Enterprise AI is moving fast, but measurable business impact remains rare. MIT’s latest research suggests that 95% of GenAI pilots fail to achieve measurable P&L impact. Meanwhile, S&P Global reports that 42% of companies abandoned most of their AI initiatives in 2025, up from 17% a year earlier.
Rather than adding another set of generic recommendations, this guide outlines a practical implementation framework that the 5% of successful enterprises use, built on research from MIT, Gartner, and Informatica’s CDO Insights. It covers how to assess AI maturity realistically, make stack decisions that avoid long-term lock-in, and set governance that meets regulatory expectations without slowing delivery.
Key takeaways:
- Purchased AI solutions succeed roughly 67% of the time versus 22% for internal builds, according to MIT NANDA 2025. The build-vs-buy decision may be the single highest-leverage choice you make.
- Organizations at MIT CISR maturity Stage 3 or higher consistently outperform industry financial averages, while Stage 1–2 organizations underperform. The transition from Stage 2 to Stage 3 is where most enterprises stall.
- Data quality issues affect 99% of AI/ML projects per Dynatrace research, yet only 43% of enterprises cite data readiness as their primary obstacle. The gap between perceived and actual data readiness kills more pilots than any technical limitation.
- Gartner predicts 40% of agentic AI projects will be canceled by 2027 due to governance failures. A roadmap needs to account for autonomous systems now, not after you deploy the first agent.
- Retail companies allocate an average of 3.32% of revenue to AI initiatives. If budgeting significantly less for a similar transformation scope, businesses are likely underfunding either technology or the people and process work that drives 70% of success.
The 95% failure rate explained: What the research actually shows
Let’s be clear about what “failure” means in this context. The MIT NANDA report uses a specific definition: failure to achieve rapid revenue acceleration. That is different from a project that simply didn’t work. Many pilots succeeded technically, with models performing as intended, integrations holding up, and users adopting the tool, but they still fell short on the business outcome.
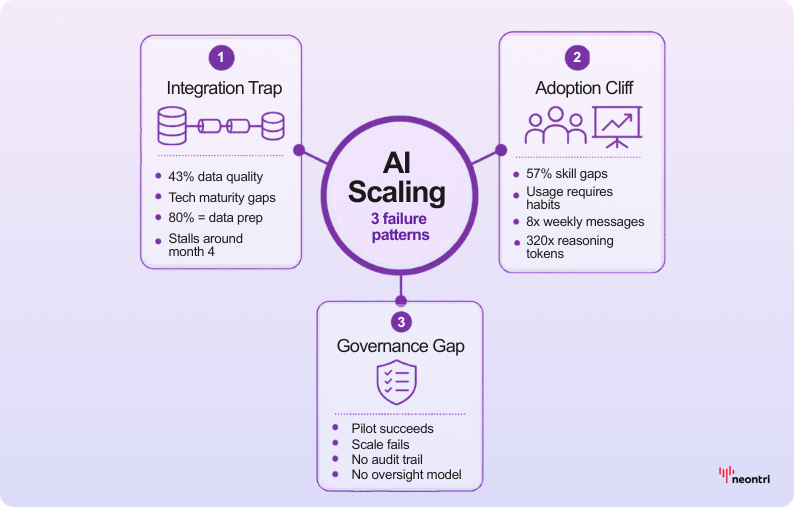
The research identifies three primary failure patterns:
Pattern 1: The integration trap. Informatica’s CDO Insights reports that 43% of enterprises cite data quality and readiness as the top obstacle. A comparable share point to gaps in technical maturity. Strong models built on clean training datasets often lose accuracy once exposed to real production data. Andrew Ng’s observation that around 80% of ML work goes into data preparation points to a practical constraint: without solid data pipelines, pilots often stall around month four.
Pattern 2: The adoption cliff. Publicis Sapient research shows that 57% of organizations cite skill gaps as the primary barrier. The challenge often appears after a model works, when teams still lack the workflows and habits to apply it consistently. The OpenAI Enterprise Report shows what sustained use looks like in successful deployments, including an 8x rise in weekly messages and a 320x increase in reasoning token consumption. Achieving that level usually requires deliberate capability building, not just a working system.
Pattern 3: The governance gap. When pilots succeed but scaling fails, governance is usually the culprit. Organizations treat governance as a compliance checkbox rather than an operating system. When the first autonomous agent makes a decision that requires explanation, they discover they have no audit trail, no escalation process, and no human oversight model.
Here’s what separates the 5% who succeed: they treat these patterns as predictable obstacles and build mitigation into their roadmap from day one.
AI maturity assessment: The MIT CISR framework applied
The MIT CISR Enterprise AI Maturity Model outlines four stages, but most guides stop at explaining what each one means. This guide goes further by showing how to assess the current stage accurately and how to progress from Stage 2 to Stage 3, where financial results start to separate.
Stage 1: Exploring (roughly 15% of enterprises)
This stage is characterized by scattered experiments and no centralized strategy. AI initiatives are driven by individual departments with separate budgets, data remains in silos, and there is no formal governance framework.
Financial performance: Below industry average. AI investment generates minimal return because efforts don’t compound.
Diagnostic questions:
If “no” applies to two or more questions, this indicates Stage 1.
Stage 2: Building capabilities (around 45% of large organizations)
This phase typically includes a centralized AI function, early investments in data infrastructure, and several pilots running in parallel. Some capabilities reach production, but coordination across business units remains limited. Governance starts to take shape, although it’s applied inconsistently.
Financial performance: Below matching industry average. Investment is concentrated but returns remain uneven.
Diagnostic questions:
This is where most enterprises stall. Moving to Stage 3 requires progress beyond technical capability and a change in operating model and decision-making.
Stage 3: Scaled ways of working (about 30% of enterprises)
At this stage, AI capabilities are built into core business processes and delivered through cross-functional teams with shared objectives. Reusable platforms and components reduce duplication across the portfolio, while governance supports safe delivery. Automated decisions also have clear human oversight, with defined accountability and controls.
Financial performance: Above industry average. Compound returns from platform investments begin materializing.
The Stage 2 to Stage 3 transition: MIT CISR research identifies this as the critical inflection point. Organizations that cross this threshold see financial performance shift from below average to significantly above. The transition usually requires:
- Dedicated platform teams (not just project teams)
- Executive-level AI governance board with decision rights
- Shared success metrics across business units
- Investment in reusable components, not one-off solutions
Stage 4: AI-integrated enterprise (around 10% of large companies)
Here, AI is embedded across operations and decision-making. Routine decisions are handled by autonomous systems, with humans overseeing exceptions, and continuous learning loops improve models in production.
Financial performance: Significantly above industry average.
Most enterprises shouldn’t target Stage 4 immediately. The research suggests 18–36 months to progress one stage, meaning a Stage 1 organization targeting Stage 4 is looking at a 5+ year transformation.
Enterprise AI maturity scorecard
Use this framework to assess the current stage across six dimensions:
| Dimension | Stage 1 | Stage 2 | Stage 3 | Stage 4 |
|---|---|---|---|---|
| Strategy alignment | No AI strategy | AI strategy exists separately | AI embedded in business strategy | AI drives strategy |
| Data infrastructure | Siloed, inconsistent | Centralized platform building | Unified, accessible | Self-optimizing |
| Talent & skills | Ad hoc hiring | AI CoE forming | Distributed AI fluency | AI-native workforce |
| Governance | None | Emerging policies | Operating model | Automated compliance |
| Delivery model | One-off projects | Program management | Platform-based | Continuous deployment |
| Business integration | Experiments | Departmental deployment | Cross-functional processes | Core operations |
Score each dimension from 1 to 4, then use the total to map the stage:
- Below 12: Stage 1
- 12–17: Stage 2
- 18–22: Stage 3
- 23–24: Stage 4
The enterprise AI implementation roadmap: Phase-by-phase framework
This five-phase roadmap integrates the maturity model with practical implementation milestones. Timeline benchmarks are calibrated to enterprise organizations (500+ employees, $100M+ revenue).
Phase 1: Foundation and alignment (months 1–4)
Objective: Establish strategic clarity and secure executive commitment with defined success criteria.
Deliverables:
- AI strategy document aligned to 3–5 business priorities
- Executive sponsor identified with budget authority
- Initial maturity assessment completed
- Governance charter drafted
- Data readiness audit initiated
Success criteria:
- Board-level presentation delivered and funded
- Cross-functional steering committee established
- Three pilot candidates identified with business owner commitment
Investment allocation: Per Promethium’s framework, this phase typically consumes 10–15% of total program budget, primarily in AI strategy consulting and assessment work.
Common pitfall
Skipping the data readiness audit. Data quality problems often surface only after a pilot struggles in production, when fixes become expensive and timelines slip.
The audit should cover:
- Timeliness (how stale the data is when it reaches the model)
- Completeness (how many required fields are populated)
- Consistency (whether entities use the same identifiers across systems)
- Accuracy (when values were last validated against a reliable source)
Phase 2: Pilot deployment (months 4–10)
Objective: Prove value through 2–3 focused pilots while building foundational capabilities.
Deliverables:
- 2–3 pilots deployed to production
- Initial platform architecture defined
- Data pipelines established for pilot use cases
- Basic governance processes operational
- Change management program initiated
Success criteria:
- At least one pilot demonstrating measurable business impact (cost reduction, revenue, efficiency)
- Reusable components identified for future use cases
- User adoption exceeding 40% of target population
- Documented lessons learned
Investment allocation: 25–35% of total budget. Split approximately: 30–40% technology, 25–35% talent, 20–30% data infrastructure, and 10–15% program management.
Common pitfall
Selecting pilots based on technical feasibility rather than business impact. Purchased solutions succeed roughly 67% of the time, compared with about 22% for internal builds.
For early pilots, lean toward buy or partner options that shorten time-to-value, and reserve custom builds for differentiated capabilities where off-the-shelf solutions are not a fit.
Phase 3: Scaling and standardization (months 10–18)
Objective: Move from pilot success to repeatable deployment patterns.
Deliverables:
- Platform architecture implemented (data, ML, integration layers)
- MLOps/LLMOps processes operational
- Governance framework enforced with audit capability
- 5–10 use cases in production
- AI Center of Excellence functioning
Success criteria:
- Time-to-deploy for new use cases reduced by 50%+ from initial pilots
- Model monitoring and drift detection operational
- Governance compliance documented and auditable
- Cross-functional use cases deployed (not just departmental)
Investment allocation: 35–45% of total budget. This is the peak investment phase where platform costs and talent ramp-up converge.
The critical transition
This phase determines whether you cross from Stage 2 to Stage 3. Organizations that remain at Stage:
- Continue funding projects but not platforms
- Lack executive-level governance with real decision authority
- Have separate metrics per project rather than shared outcomes
- Haven’t established reusable components
Phase 4: Enterprise integration (months 18–30)
Objective: Embed AI into core business processes with autonomous capabilities where appropriate.
Deliverables:
- AI integrated into 3–5 core business processes
- Human-AI collaboration models defined for each process
- Continuous learning loops operational
- Advanced governance for autonomous decisions
- Agentic AI pilots initiated (if appropriate)
Success criteria:
- Measurable P&L impact from AI-integrated processes
- Decision audit trails complete and reviewable
- Model accuracy maintained within SLAs
- Regulatory compliance demonstrated
Investment allocation: 15–20% of total budget. Operational costs begin exceeding project costs as deployed systems scale.
Phase 5: Continuous optimization (month 30+)
Objective: Sustain competitive advantage through continuous improvement and emerging capability integration.
Deliverables:
- AI performance dashboards operational
- Emerging technology evaluation process
- Talent development pipeline
- Regular governance reviews and updates
Success criteria:
- Year-over-year improvement in AI-driven business metrics
- Successful integration of new AI capabilities within established timelines
- Governance framework adapts to regulatory changes
- Talent retention and capability growth on track
Investment allocation: Ongoing operational budget. Industry benchmarks suggest 3–4% of revenue for mature AI operations in technology-forward industries.
Build vs. buy vs. partner: The decision matrix
This is one of the highest-leverage choices, and one many enterprises don’t examine deeply enough. In practice, off-the-shelf products often reach value faster and with significantly less execution risk than building from scratch, often making success roughly 3x more likely.
That said, the right answer isn’t always “buy.” The best choice depends on context: business goals, time constraints, risk tolerance, and the capabilities required.
Decision criteria framework
Use this framework to compare build, buy, and partner across the factors that most strongly influence speed, risk, and long-term value.
| Criterion | Build | Buy | Partner |
|---|---|---|---|
| Differentiation potential | High (unique advantage) | Low (commoditized) | Medium (customization needed) |
| Time to value | 12–24 months | 3–6 months | 6–12 months |
| Internal capability | Strong ML/engineering team | Limited technical depth | Some capability, gaps exist |
| Data sensitivity | Highly proprietary | Standard industry data | Mixed requirements |
| Customization needs | Significant (>60% custom) | Limited (<20% custom) | Moderate (20-60% custom) |
| Long-term cost | Lower (if successful) | Higher (licensing) | Variable (depends on contract) |
| Success probability | ~22% (MIT NANDA) | ~67% (MIT NANDA) | ~50% (estimated) |
When to build
Build when AI capability directly creates competitive differentiation that can’t be replicated with off-the-shelf tools. Examples:
- Proprietary pricing algorithms based on unique data
- Custom recommendation systems reflecting brand positioning
- Operational optimization using proprietary process knowledge
Build requirements:
- Executive tolerance for ~22% success probability
- Dedicated ML/LLM engineering team (minimum 3-5 FTEs)
- Established MLOps/LLMOps practices
- 18+ month investment horizon
When to buy
Buy when the capability is commoditized and time-to-value matters more than customization. Examples:
- Document processing and extraction
- Customer service chatbots for standard inquiries
- Fraud detection using industry-standard patterns
- Sales forecasting for common business models
Buy requirements:
- Clear integration path to existing systems
- Vendor stability and support quality verified
- Total cost of ownership calculated over 3 years
- Exit strategy defined (data portability, contract terms)
When to partner
Partner when you need customization but lack internal capability to build. Examples:
- Industry-specific solutions requiring domain expertise
- Complex integrations spanning multiple systems
- Capabilities requiring ongoing model management you can’t staff
Partnership requirements:
- Clear intellectual property agreement
- Knowledge transfer plan
- Defined success metrics with accountability
- Escalation and exit provisions
The technology stack decision tree
Technology decisions made in Phase 1–2 will constrain or enable your options for years. Most enterprise AI guides mention “technology selection” without providing actual decision criteria. Here’s the framework.
Layer 1: Data platform
Decision: Cloud data warehouse vs. data lakehouse vs. hybrid
| Platform type | Best for | Watch out for |
|---|---|---|
| Cloud data warehouse (Snowflake, BigQuery, Redshift) | Structured data, SQL-heavy teams, fast time-to-value | Unstructured data challenges, compute costs at scale, vendor lock-in |
| Data lakehouse (Databricks, Delta Lake) | Mixed data types, ML workloads, data science-heavy teams | Delta/Iceberg format sprawl, metastore management, and cluster tuning |
| Hybrid | Existing investments, gradual migration | Integration overhead, duplicate costs during transition (“transition” often becomes permanent) |
Selection criteria:
- What percentage of the AI use cases require unstructured data (documents, images, audio)? >40% suggest a lakehouse.
- Does the data team primarily use SQL or Python/Spark? SQL points to the warehouse.
- What’s the current cloud provider relationship? Single-cloud often simplifies.
Layer 2: ML/AI platform
Decision: Managed ML platform vs. custom MLOps stack vs. LLM-centric platform
| Platform type | Best for | Examples |
|---|---|---|
| Managed ML platform | Traditional ML models, structured predictions | AWS SageMaker, Google Vertex AI, Azure ML |
| Custom MLOps stack | Maximum flexibility, strong engineering team | MLflow, Kubeflow, custom pipelines |
| LLM-centric platform | GenAI focus, rapid prototyping | Anthropic, OpenAI, AWS Bedrock, Azure OpenAI |
Selection criteria:
- Are most of the planned use cases traditional ML (prediction, classification) or generative AI? This determines the primary platform.
- Do you need fine-tuning capability or will prompt engineering suffice? Fine-tuning requires more infrastructure.
- What’s your security posture? Highly regulated industries may require private deployments.
Layer 3: LLM selection (for GenAI use cases)
Decision: Commercial LLM vs. open-source LLM vs. hybrid
| Option | Best for | Considerations |
|---|---|---|
| Commercial LLM APIs (GPT, Claude, Gemini) | Speed, capability, managed infrastructure | Data privacy, vendor lock-in, usage costs |
| Open-source LLMs (Llama, Mistral, Qwen) | Data sovereignty, cost control, customization | Operational complexity, capability gaps, complex scaling |
| Hybrid | Tiered use cases, cost optimization | Integration complexity, governance overhead |
OpenAI’s Enterprise Report shows reasoning-token consumption can grow by as much as 320x as use cases mature, so pricing should be chosen with expected usage growth in mind.
Layer 4: Integration and orchestration
Decision: Custom integration vs. integration platform vs. vendor-native connectors
For agentic AI use cases (autonomous agents), orchestration becomes particularly important. Framework options include LangChain, Langgraph, Crew AI, LlamaIndex, and proprietary solutions. Define the right balance of agent autonomy and the human-in-the-loop controls required to keep it safe and accountable.
Industry-specific roadmap variations
Generic AI roadmaps fail because they ignore the regulatory, data, and use case differences across industries. Here are the adjustments for four major verticals.
Healthcare: 24–36 month implementation timeline
Healthcare moves slower because clinical validation and patient-data controls add hard constraints.
Regulatory considerations:
- HIPAA compliance required for any patient data
- FDA 510(k) clearance potentially needed for clinical decision support
- State-by-state telehealth regulations
Typical use cases by phase:
- Phase 2: Administrative automation (scheduling, prior authorization, coding)
- Phase 3: Clinical documentation support, patient communication
- Phase 4: Clinical decision support, population health management
Healthcare-specific success factors:
- Clinical validation requirements extend timelines 40–60%
- Physician champions required (IT-led initiatives stall)
- EMR integration is table stakes – plan for it from Phase 1
Financial services: 18–30 month implementation timeline
Financial services timelines are shaped by model risk governance and explainability requirements from day one.
Regulatory considerations:
- Model risk management (OCC SR 11-7, Fed SR 15-18)
- Fair lending and bias testing requirements
- Explainability requirements for credit decisions
- SOX compliance for financial reporting systems
Typical use cases by phase:
- Phase 2: Fraud detection, document processing, customer service
- Phase 3: Credit underwriting support, AML transaction monitoring
- Phase 4: Algorithmic trading, personalized financial advice
Financial services-specific success factors:
- Model governance must satisfy regulatory exam requirements
- Explainability often trumps performance for regulated decisions
- Third-party risk management extends vendor evaluation
Manufacturing: 18–24 month implementation timeline
Manufacturing success depends on reliable shop-floor data and tight OT/IT integration.
Regulatory considerations:
- Workplace safety regulations for autonomous systems
- Quality management system (QMS) integration
- Industry-specific standards (ISO, FDA for medical devices)
Typical use cases by phase:
- Phase 2: Predictive maintenance, quality inspection, demand forecasting
- Phase 3: Production optimization, supply chain visibility
- Phase 4: Autonomous robotics, digital twin integration
Manufacturing-specific success factors:
- OT/IT convergence is prerequisite – many manufacturers underestimate this
- Edge computing requirements for latency-sensitive applications
- Workforce transition planning for automation impact
Retail: 12–24 month implementation timeline
Retail programs are driven by real-time customer experiences and seasonal demand peaks.
Regulatory considerations:
- Consumer data privacy (CCPA, state laws, potential federal)
- Age verification for restricted products
- Pricing transparency requirements
Typical use cases by phase:
- Phase 2: Demand forecasting, personalization, inventory optimization
- Phase 3: Dynamic pricing, customer service automation
- Phase 4: Autonomous store operations, supply chain automation
Retail-specific success factors:
- Real-time inference requirements for customer-facing applications
- Seasonal demand spikes require scalable infrastructure
- Omnichannel data integration typically more challenging than expected
Per industry benchmarks, retail companies allocate an average of 3.32% of revenue to AI initiatives. Underfunding relative to this benchmark correlates with longer timelines and lower success rates.
Enterprise AI governance: The operating model
Governance is where most enterprise AI initiatives either scale or stall. The mistake is treating governance as compliance rather than as an operating system that enables speed with appropriate guardrails.
Governance structure
A practical governance model clarifies ownership, decision rights, and escalation paths.
AI ethics and governance board
- Composition: CDO/CIO (chair), business unit leaders, legal, risk, HR representative
- Meeting cadence: Monthly for strategic decisions, as-needed for escalations
- Decision rights: Use case approval, policy exceptions, risk acceptance
Model risk management function
- Reports to: Chief Risk Officer (or equivalent)
- Responsibilities: Model validation, bias testing, performance monitoring, regulatory compliance
- Staffing: Typically 1 FTE per 10–15 models in production for regulated industries
AI center of excellence
- Reports to: CDO or CTO
- Responsibilities: Standards, best practices, platform management, training, use case prioritization
- Staffing: Core team of 5–10 for $1B+ enterprises, scaled by AI maturity
Governance policy framework
Policies turn governance into repeatable decisions and consistent controls.
Use case evaluation criteria:
- Business value potential (quantified)
- Data requirements (availability, quality, privacy)
- Technical feasibility (complexity, timeline)
- Risk profile (regulatory, reputational, operational)
- Resource requirements (budget, talent, timeline)
Model risk classification: Assign each model a risk tier based on impact, autonomy, and regulatory exposure.
| Risk tier | Criteria | Governance requirements |
|---|---|---|
| Tier 1 (High) | Regulated decisions, significant financial impact, customer-facing autonomous | Full validation, ongoing monitoring, annual review, board reporting |
| Tier 2 (Medium) | Internal decisions, moderate financial impact, human-in-the-loop | Validation, quarterly monitoring, annual review |
| Tier 3 (Low) | Productivity tools, limited financial impact, advisory only | Documentation, periodic review |
Audit and compliance framework
Make controls explicit before launch, then track them consistently in production.
Pre-deployment requirements:
- Bias and fairness testing (documented methodology and results)
- Explainability documentation (appropriate to risk tier)
- Data lineage and quality certification
- Security and privacy review
- Business owner sign-off
Ongoing monitoring requirements:
- Model performance (accuracy, latency, availability)
- Data drift detection
- Fairness metric tracking
- Usage and adoption metrics
- Incident tracking and resolution
Agentic AI: Extending your roadmap for autonomous systems
Gartner predicts that by 2026, 40% of enterprise apps will feature task-specific AI agents, up from less than 5% in 2025. The same research warns that almost half of agentic AI projects may be abandoned or fail to reach production by 2027 due to governance weaknesses—take a closer look at enterprise AI agents in practice.
An enterprise AI roadmap should account for autonomous systems now, before the first agent goes off-script.
Agentic AI maturity model
Increase autonomy in stages, and prove controls in production before moving up.
Level 1: Assisted agents (where most enterprises should start)
- Agents suggest actions, humans approve
- Full audit trail of recommendations and decisions
- Human-in-the-loop for all consequential actions
Level 2: Supervised agents
- Agents execute routine decisions within defined parameters
- Human oversight for exceptions and edge cases
- Automated escalation when confidence thresholds not met
Level 3: Autonomous agents
- Agents operate independently within bounded domains
- Human oversight for policy exceptions and appeals
- Continuous monitoring with circuit breakers
Agentic AI governance requirements
Beyond standard AI governance, agentic systems require:
- Scope boundaries: What can the agent do? What is explicitly prohibited?
- Confidence thresholds: When must the agent escalate versus act?
- Circuit breakers: What conditions trigger automatic shutdown?
- Audit completeness: Is it possible to explain every decision the agent made?
- Rollback capability: Can you undo agent actions if needed?
- Human override: How quickly can a human intervene?
Agentic AI pilot framework
Start with bounded tasks and clear escalation, rollback, and oversight.
Use cases appropriate for early agentic pilots:
- Internal process automation with clear boundaries
- Customer service for routine, low-stakes inquiries
- Data analysis and report generation
- Code review and documentation tasks
Use cases requiring mature capabilities before deployment:
- Financial transactions
- Customer-facing decisions with regulatory implications
- Autonomous external communications
- System configuration changes
Financial planning and ROI framework
The budget should scale with maturity, and the largest investment typically occurs during scaling and integration.
Investment planning by phase
Based on industry benchmarks and the investment allocation framework:
| Phase | % of total budget | Primary spend categories |
|---|---|---|
| 1: Foundation | 10–15% | Strategy consulting, assessment, program setup |
| 2: Pilots | 25–35% | Technology (30–40%), talent (25–35%), data (20–30%), PM (10–15%) |
| 3: Scaling | 35–45% | Platform build-out, team expansion, integration |
| 4: Integration | 15–20% | Process integration, advanced capabilities |
| 5: Optimization | Ongoing | Operations, maintenance, continuous improvement |
ROI calculation framework
Standardize cost and value components so initiatives can be compared consistently.
Cost components:
- Technology: Platform licensing, compute, storage
- Talent: Full-time employees, contractors, training
- Data: Acquisition, cleaning, infrastructure
- Services: Consulting, implementation partners
- Operations: Ongoing maintenance, monitoring, support
Value components:
- Efficiency gains: Time saved × labor cost × adoption rate
- Revenue impact: Incremental revenue × attribution factor
- Cost reduction: Process cost before – process cost after
- Risk mitigation: Expected loss × probability reduction
ROI formula:
ROI = (Total Value – Total Cost) / Total Cost × 100
Payback Period = Total Cost / Annual Value
Benchmark expectations:
- Phase 2 ROI: Often negative or marginal (pilot investment)
- Phase 3 ROI: Break-even to 50% (scale economics begin)
- Phase 4+ ROI: 100–300% for successful programs (MIT CISR Stage 3–4)
Red flags in AI investment proposals
Watch for these warning signs when evaluating AI initiatives:
- ROI projections exceeding 500% in year one. Most real AI projects show modest returns initially, with compound benefits in years 2–3.
- Timelines under 6 months for enterprise deployment. Unless you’re deploying a turnkey SaaS solution, this is unrealistic.
- No budget for data work. If the proposal doesn’t allocate 20–30% to data infrastructure and quality, it’s underestimating the work.
- A 100% internal build plan is a high-risk default. In most enterprise programs, buying or partnering tends to deliver faster value with fewer execution pitfalls, so an all-build strategy needs strong justification.
- No change management allocation. Technology without adoption is waste. Budget for training, communication, and organizational change.
- Missing governance costs. This is a common gap, especially in regulated industries where model risk management adds real, ongoing overhead.
- Single use case justification. Platform investments need portfolio justification, not single project ROI.
- No failure contingency. What happens if the pilot doesn’t work? Exit costs and pivot options should be explicit.
Implementation checklist: 90-day action plan
Use this checklist to translate the roadmap into action. Prioritize based on the current maturity stage.
Stage 1 organizations: Months 1–3
Stage 2 organizations: Months 1–3
Vendor evaluation framework
None of the competitive content provides a structured vendor evaluation approach. Here’s the framework.
Vendor evaluation scorecard
Score each dimension 1–5 (1 = weak, 5 = strong). Weight according to your priorities.
| Dimension | Weight | Vendor A | Vendor B | Vendor C |
|---|---|---|---|---|
| Technical capability | ||||
| Core functionality fit | 15% | |||
| Integration capability | 10% | |||
| Scalability | 10% | |||
| Performance benchmarks | 5% | |||
| Security & compliance | ||||
| Security certifications | 10% | |||
| Data privacy controls | 10% | |||
| Regulatory compliance | 10% | |||
| Vendor viability | ||||
| Financial stability | 5% | |||
| Customer references | 5% | |||
| Product roadmap | 5% | |||
| Commercial terms | ||||
| Pricing model | 5% | |||
| Total cost of ownership | 5% | |||
| Contract flexibility | 5% | |||
| Weighted Total | 100% |
Due diligence questions
Use these questions to validate timelines, security posture, and commercial scalability early.
Technical:
- What is the average implementation timeline for organizations of our size and industry?
- How are data residency requirements handled for [our regions]?
- What is the SLA for model inference latency and availability?
- How do you manage model versioning and rollback?
Security:
- What certifications do you hold (SOC 2 Type II, ISO 27001, HIPAA, etc.)?
- How is customer data isolated in multi-tenant environments?
- What’s your incident response process and notification timeline?
- How is subprocessor management handled?
Commercial:
- What’s the pricing model (per user, per API call, per compute hour)?
- How does pricing scale if usage increases 10x?
- What are the contract termination provisions and data export capabilities?
- Are there minimum commitments or volume discounts?
Conclusion
The 95% failure rate is avoidable. It comes from predictable patterns that deliberate planning can address. Organizations that succeed treat AI transformation as an operating system change, prioritizing data readiness, smart build vs buy decisions, and governance that enables speed with accountability.
Next, complete the maturity assessment scorecard to confirm the real starting point. Then build a roadmap around that stage, review it quarterly, and adjust based on outcomes.