

Mobile performance is no longer a technical “nice-to-have” or a post-launch optimization task. It directly affects retention, conversion, ratings, and revenue.
Users now expect apps to load fast, react instantly, and run smoothly every time. If the experience feels slow or unstable, they won’t look for a fix; they will look for a competitor.
Based on Neontri’s experience in mobile audits, this guide covers the mobile app performance benchmarks that matter most, along with the targets teams should aim for and the actions to take when performance slips.
Key takeaways:
- A cold start above 3 seconds loses the user before the app begins.
- Crash-free rate below 99% is not a minor issue. It’s a retention crisis.
- In banking apps, slow login and failed payments are not UX problems, they are trust problems.
- Background battery drain and memory overuse cause silent uninstalls that never show up in crash reports.
- AI features need to respond in under 500 ms or users assume they are broken.
- Performance regressions caught after release cost ten times more to fix than those caught before.
Core performance benchmarks
These benchmarks show whether the app is fast, stable, and efficient enough to perform well in everyday mobile use.
#1: App load time
App load time measures how long it takes to reach the first usable screen after a user taps the app icon.
Why it matters: It’s one of the earliest points where users decide whether to stay or leave. Once launch time goes beyond 3 seconds, abandonment rises sharply.
To track it properly, monitor:
- Cold starts from scratch
- Warm starts from the background
- Hot starts when the app is already active
Benchmark: Cold start ≤2s (best) / >3s (poor); Warm start ≤1s
If underperforming: Load only what the user needs for the first screen, and move non-critical work such as analytics, databases, and SDKs until after launch.
Example: HeadOut reduced its travel app cold start time by over 40%. By using native splash screens and parallel loading, their app loaded in under 2 seconds.
#2: First-time user vs returning user performance
It measures the gap in load times, responsiveness, and flow completion rates between a user’s very first session and every session after that. First sessions carry empty caches and additional setup work that adds latency returning users never see.
Why it matters: New users are the most expensive to acquire and the least likely to get a second chance – their first session needs to perform as well as every session after it.
Benchmark: No more than 20% difference in load time and flow completion rate between first-time and returning sessions.
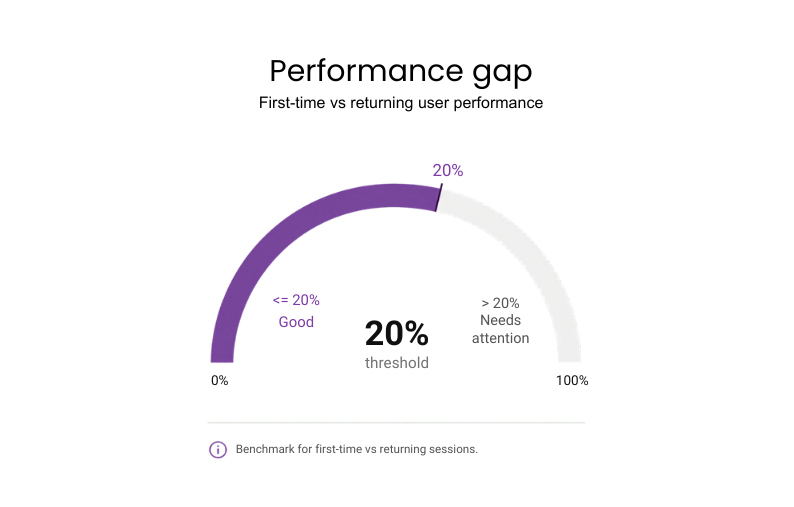
If underperforming: Optimize the “cold” load by lazy-loading non-essential assets to prioritize the sign-up flow.
#3: Tap response time
The delay between a user’s physical tap and the app’s first visible reaction defines how responsive the interface feels.
Why it matters: The app that reacts instantly gives users the feeling that every tap is working exactly as expected. That makes completing key tasks smoother and less frustrating.
Benchmark: Under 100 ms
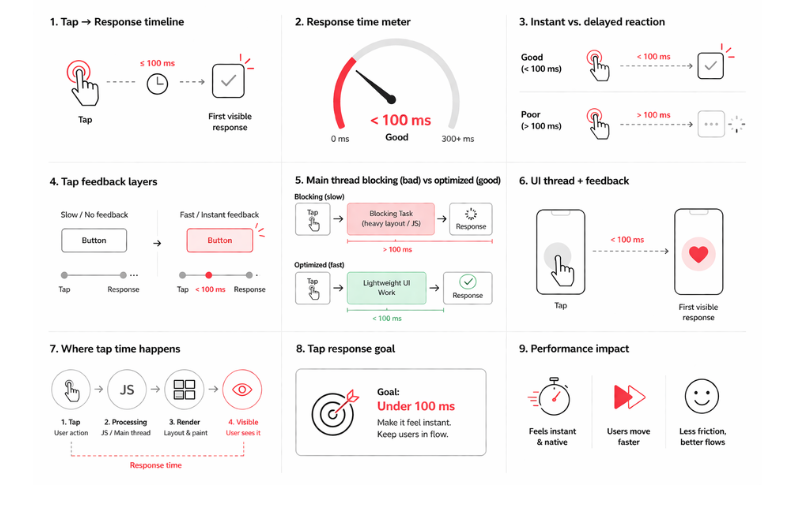
If underperforming:
- Profile the UI thread to find what is slowing it down, such as heavy layouts. For hybrid or cross-platform apps, check JavaScript execution too, especially if it blocks the bridge or main thread.
- Show instant feedback on touch and simplify UI layers so the first visible response appears faster.
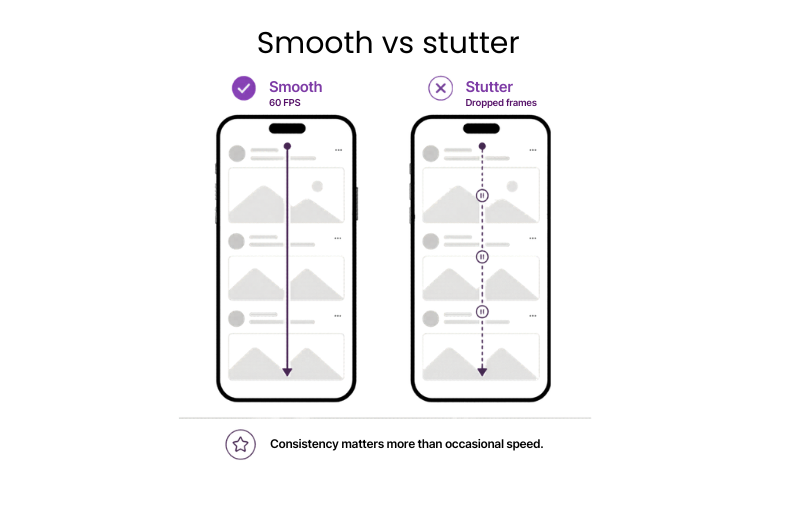
#4: Smooth scrolling
Scrolling is one of the fastest ways users judge app quality. This metric shows how consistently the app moves through lists, feeds, and other scroll-heavy screens.
Why it matters: Smooth scrolling helps users browse content-heavy screens more easily, discover more products or content and reach a decision point without getting frustrated.
Benchmark: Stable 60 FPS (frames per second) without micro-stutters
If underperforming:
- Reduce overdraw and simplify scroll-heavy layouts.
- Optimize image loading and keep background tasks off active screens.
- In hybrid apps, reduce JavaScript bridge activity during scrolling.
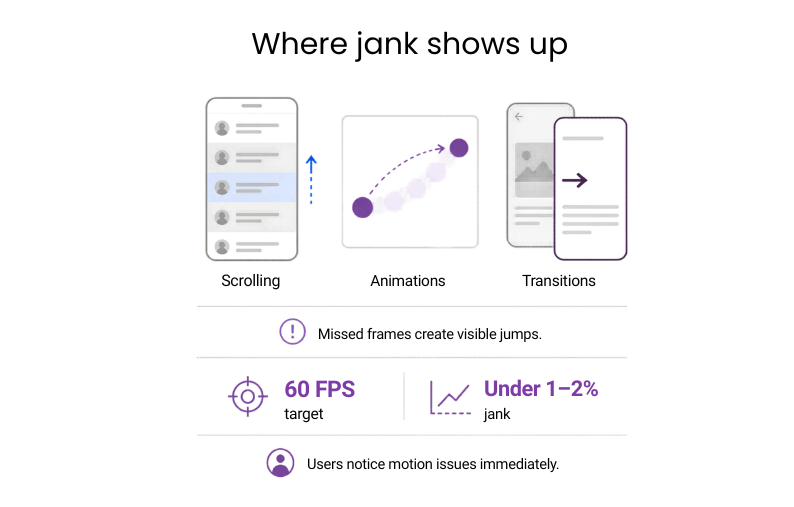
#5: Frame drops and jank
Frame drops and jank show how often the app misses the frame timing needed for smooth motion. Most phones target 60 FPS, which gives each frame about 16 ms to render, so every miss can create a visible jump in scrolling, animations, or transitions.
Why it matters: Tracking jank early helps teams protect product quality before visual issues start affecting ratings and retention.
Benchmark: Under 1–2% (Google/Apple standard; human eye spots jank >0.5-1%)
If underperforming:
- Profile the Main Thread for tasks >16 ms (e.g. layouts or image decodes).
- Break them into <16 ms chunks or offload to background threads so every frame deadline is met.
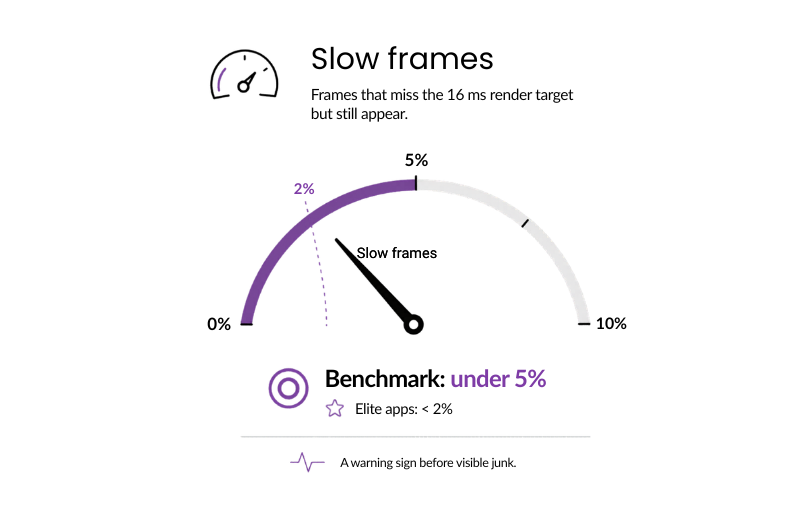
#6: Slow frames
These are frames that miss the 16 ms render target but still get rendered. The key measure is how often that happens. They may not cause clear stutter, but they show that the app is running too close to its limits.
Why it matters: Slow frames signal rendering strain before it surfaces. Resolving it now is far more cost-effective than fixing the resulting user friction later.
Benchmark: Under 5% (industry standard) / <2% (elite apps)
If underperforming:
- Throttle animations on scroll-heavy screens first.
- Defer non-critical paints (e.g., backgrounds) until after the frame deadline.
Architecture affects performance ceilings, so compare native vs hybrid app performance before choosing a stack for latency-sensitive products
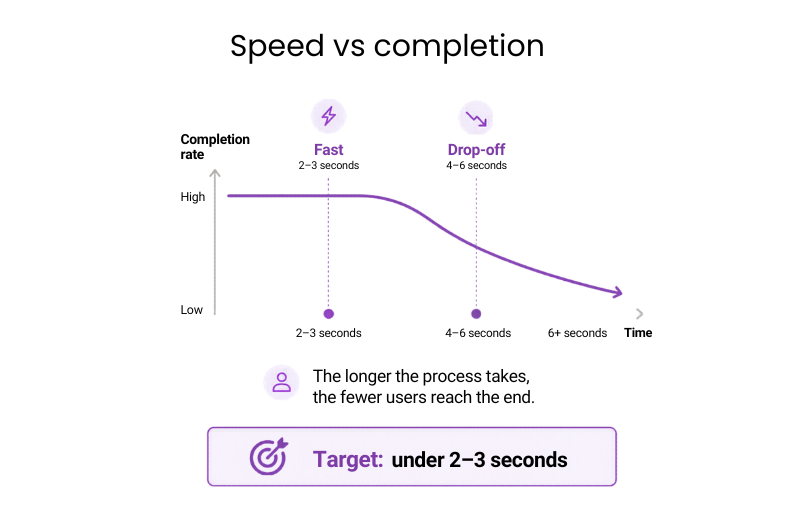
#7: Time to task completion
This is where performance starts to affect revenue directly. The metric captures how long users need to complete a critical flow such as a payment, booking, or form submission.
Why it matters: In high-value flows, speed has a direct effect on completion. The longer the process takes, the fewer users reach the end.
Benchmark: Under 2–3 seconds
If underperforming:
- Map your highest-value user journeys and look for sequential API calls that could run in parallel.
- Render-blocking steps on critical screens are usually the fastest win to reduce wait times.
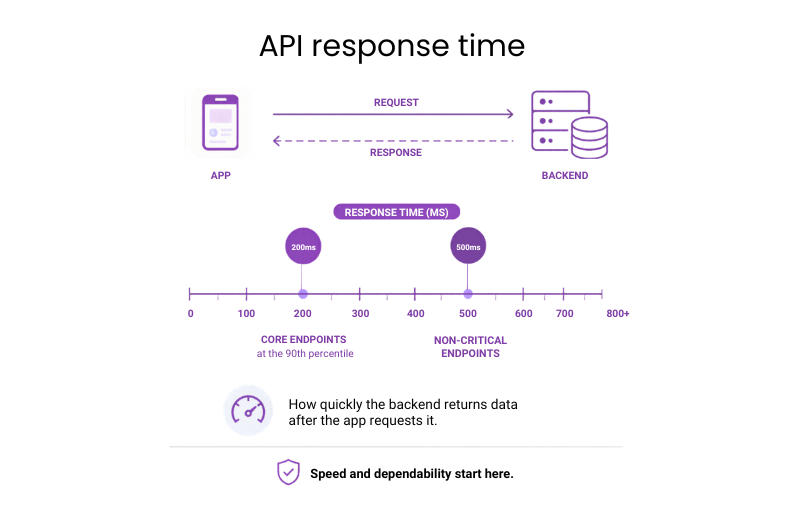
#8: API response time
API response time covers how quickly the backend returns data after the app requests it.
Why it matters: This is one of the core indicators of whether the product can deliver a fast, dependable experience at scale.
Benchmark: Under 200 ms at the 90th percentile for core endpoints; under 500 ms for non-critical ones
If underperforming:
- Identify the slowest endpoints first using real user monitoring rather than synthetic tests.
- Look for sequential calls that could run in parallel before boosting individual endpoint speed.
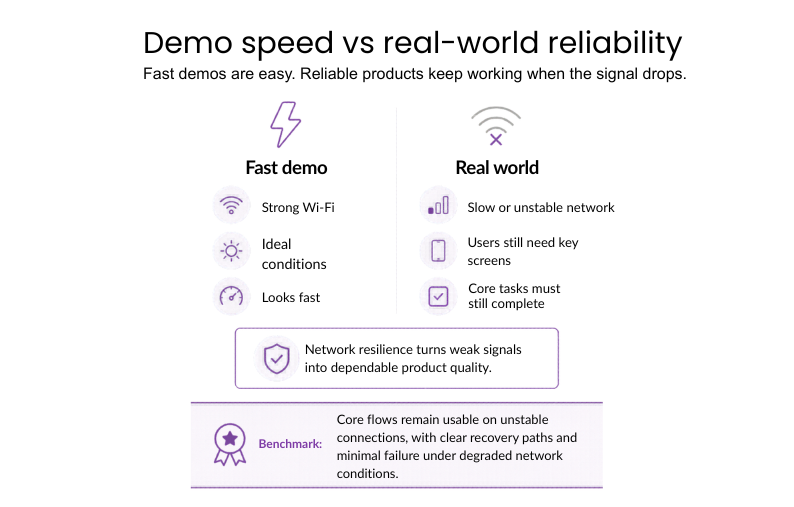
#9: Network resilience
Network resilience tests how well the app works even under poor, slow, and unstable connections. The user still needs to load key screens and be able to perform important tasks even if the signal drops. This distinguishes fast demo results from reliable actual behavior.
Why it matters: Network durability guarantees that the app remains fast and fully functional anywhere, converting a poor connection into a quality user experience.
Benchmark: Critical flows need to remain available even in the case of network instability, making sure there are recovery strategies and no failures on degraded networks.
If underperforming:
- Identify which flows suffer the most because of latency, packet loss, or poor connection.
- Add retries, fallbacks, clearer loading, and error states.
- Reduce payloads and make key screens independent of the network.
Example: Uber used Optimistic Mode in its driver app so trips could start or end even when the network was weak. The app moved forward first and synced with the server later, saving about 13.5 seconds per operation.
#10: Time to recover from failure
The interval starts when a flow fails and ends when the user can continue, retry, or complete the task successfully.
Why it matters: Recovery speed determines whether a failure stays contained or turns into a lost action.
Benchmark: Recovery path visible in under 2 seconds after failure
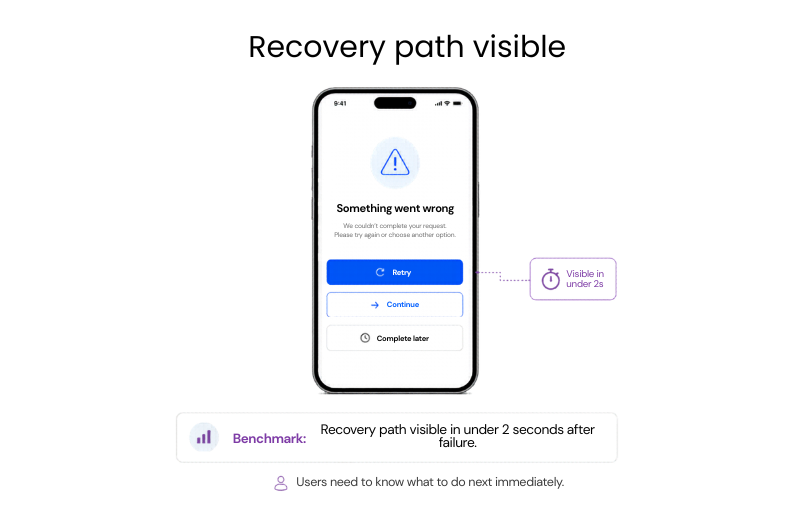
If underperforming: Shorten the path back to action by replacing dead-end error states with
clear retry and recovery options.
#11: Session length vs speed
This metric looks at how app responsiveness shapes the length and quality of user sessions.
Why it matters: Faster apps tend to keep users active for longer, which makes this one of the clearest links between technical performance and product health.
Benchmark: 20-30% longer sessions with better speed
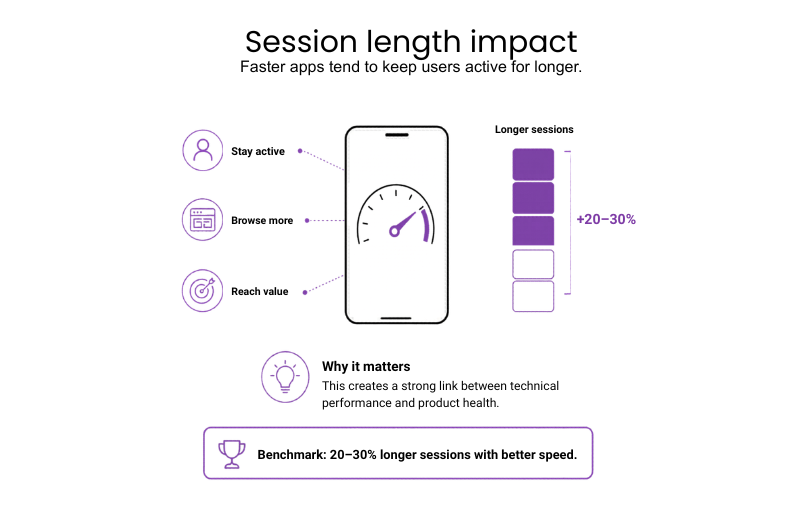
If underperforming: A/B test single speed fixes to prove engagement gains
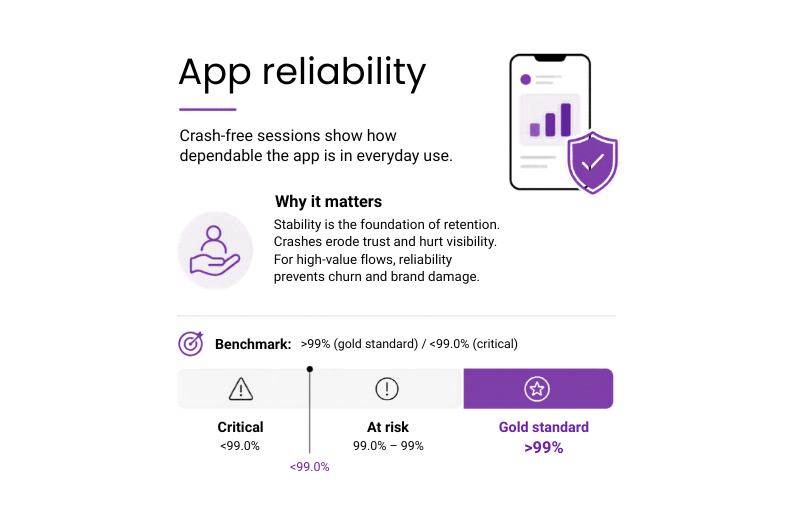
#12: Crash-free sessions
It’s the share of app sessions that end without a crash, reflecting how dependable the app is in everyday use.
Why it matters: Stability is the foundation of retention. Crashes erode user trust and tank store visibility. For critical flows like payments, reliability is non-negotiable to prevent churn and brand damage.
Benchmark: >99% (gold standard) / <99.0% (critical)
If underperforming:
- Prioritize fixes by user impact using Crashlytics or a similar reporting tool.
- Use staged rollouts to catch environment-specific bugs before they affect the full user base.
- Focus first on crashes in login, payments, onboarding, and other high-value flows.
Example: Instabug’s 2025 Mobile App Stability Outlook reports that the best-performing 25% of mobile apps reach 99.99% crash-free sessions, while poorer apps sit around 99.77%. That small gap can mean thousands of extra failed sessions at scale, with a clear impact on user reliance, app ratings, and retention.
#13: Memory footprint
Memory footprint tracks how much RAM the app uses in normal operation. When it gets too high, the system starts slowing background activity or closing the app, especially on mid-range and older devices.
Why it matters: Memory use directly affects how reliably the app runs across the devices most users actually have.
Benchmark: Keep peak RAM usage as low as practical for the app type; sustained usage above 200 MB should be reviewed closely.
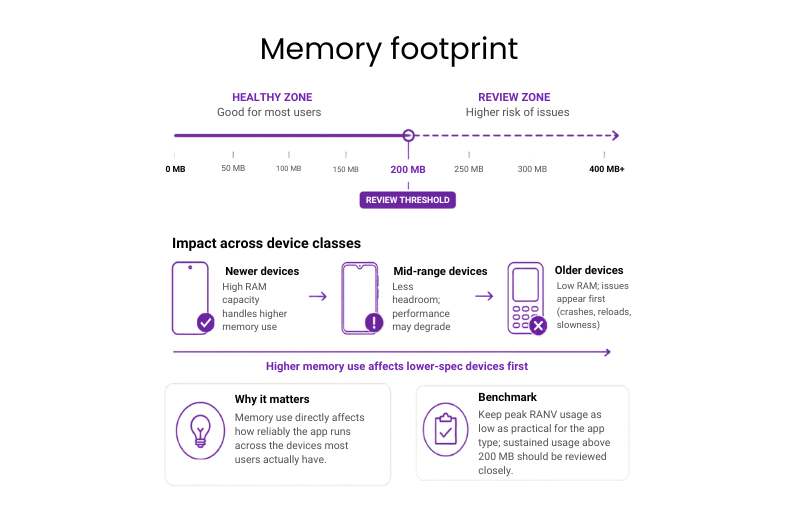
If underperforming: Find the screens with the highest memory use, shrink oversized assets and caches, and close leaks before they turn into crashes.
Example: Bomberbot (an educational coding platform for kids) cut peak memory use in its Android app by 50% with bitmap optimization and leak fixes. Low-end devices stopped running out of memory, and scrolling stayed stable within the <200MB sustained benchmark.
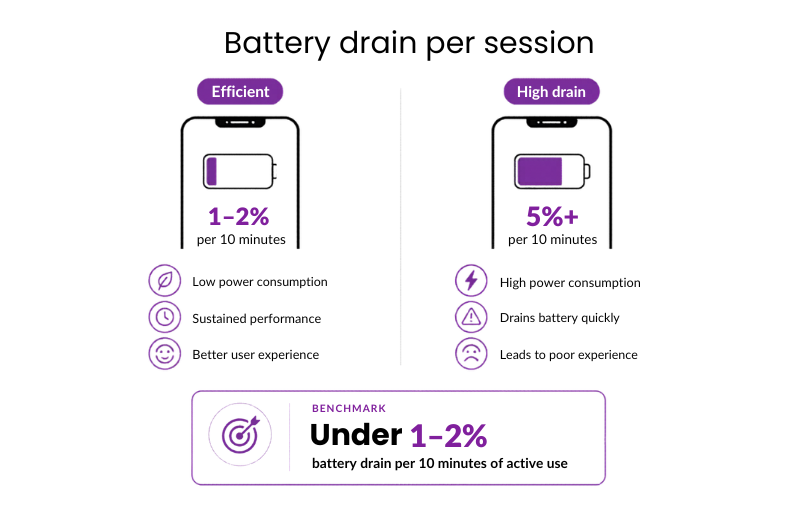
#14: Battery drain per session
Battery drain per session captures how much power the app consumes during normal use.
Why it matters: High power consumption during active sessions leads to “battery anxiety,” causing users to prematurely close the app or avoid using it when they aren’t near a charger.
Benchmark: Under 1–2% battery drain per 10 minutes of active use
If underperforming:
- Reduce high-accuracy GPS polling.
- Simplify GPU-heavy animations first, then test battery impact on mid-range devices.
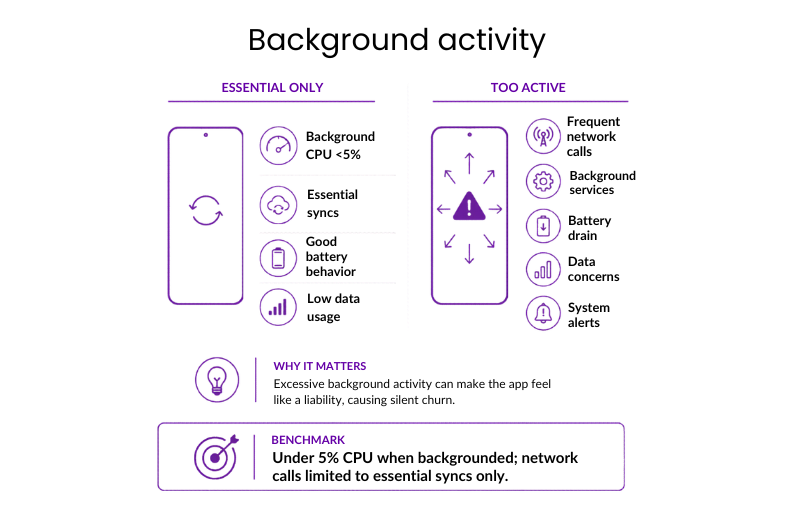
#15: Background activity
Background activity covers CPU and network use while the app runs outside the active screen, including syncs, location checks, refreshes, and background services.
Why it matters: Excessive background activity triggers system-level alerts and “silent churn,” as users uninstall apps they perceive as a liability to their device’s battery and data.
Benchmark: Under 5% CPU when backgrounded; network calls limited to essential syncs only
If underperforming:
- Replace continuous background processes with event-driven triggers.
- Remove any background task that isn’t essential.
#16: Accessibility performance
This metric checks whether the app stays fast and easy to use when accessibility settings are turned on, such as screen readers, larger text, or reduced motion.
Why it matters: In many markets, accessibility is already a legal requirement. For the business, this metric shows whether the product still performs properly for users who rely on assistive technology.
Benchmark: Turning on accessibility features shouldn’t cause visible slowdown, extra crashes, or broken layouts.
If underperforming:
- Include TalkBack and VoiceOver in the standard release cycle.
- Fix structural issues in layouts and markup before adding more accessibility layers on top.
Example: Slack has made their iOS application accessible by including features such as VoiceOver, font size adjustment, reduced animations, improved contrast, and accessibility testing. This example shows that accessibility must be integrated into day-to-day product quality, and not considered separately.


Get a clear picture of your app’s performance against the benchmarks that drive retention and revenue
Stop guessing and let Neontri’s experts review your mobile app for performance, security, and code quality.
Banking and fintech app benchmarks
For banking and fintech products, the real test is whether the platform can support access, payments, and account updates without delay in the flows that matter most. Also, mobile banking app development requires stricter performance targets because users expect fast, secure access to balances, transfers, cards, and payments
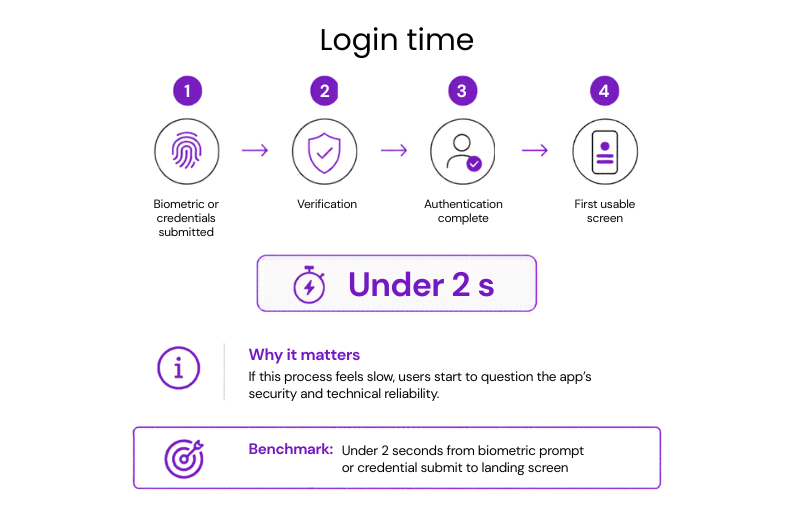
#17: Time to login
The full login window runs from submitting credentials or biometrics to reaching the first usable screen.
Why it matters: If this process feels slow, users start to question the app’s security and technical reliability.
Benchmark: Under 2 seconds from biometric prompt or credential submit to landing screen
If underperforming:
- Reduce sequential API calls during authentication.
- Move non-critical checks until after login is complete.
#18: Login success rate
This metric measures the number of users who are able to authenticate themselves and gain access to their accounts using any method, from credentials and biometrics to passkeys or two-factor authentication.
Why it matters: Login success determines whether access was successful in practical terms. Failing to do that would mean losing users’ trust even before the first interaction inside the application.
Benchmark: Above 95% successful login completion on stable networks.
If underperforming:
- Find the login step where users fail or leave most often.
- Remove the cause, whether it is delay, unclear messaging, technical errors, or too much friction.
Example: PayPal introduced passkeys to eliminate the need for typing passwords into the login screen. Early reports showed that those using passkeys had 10%+ higher login success rates (reaching 95%+ benchmark) compared to users relying on traditional passwords.
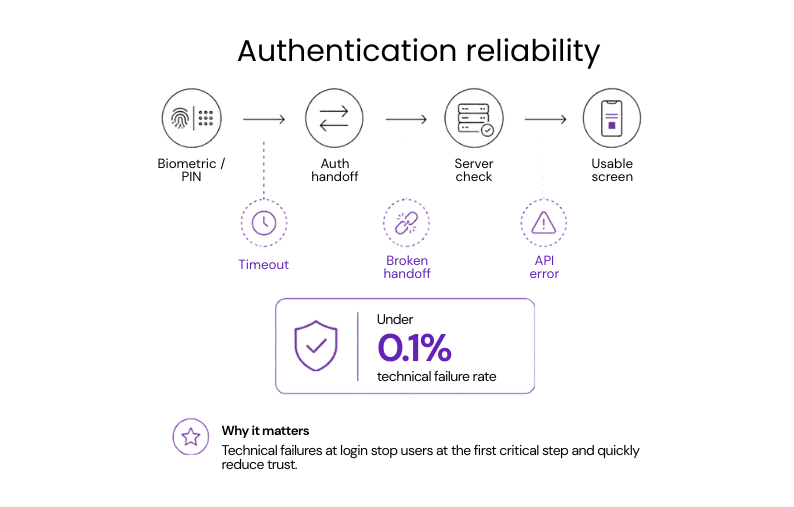
#19: Failure rate of authentication
Authentication reliability depends on how often biometric or PIN attempts fail because of timeouts, broken handoffs, or API errors rather than incorrect user input.
Why it matters: Technical failures at login block access at the first critical step and quickly drive frustration, support requests, and loss of trust.
Benchmark: Under 0.1% technical failure rate
If underperforming: Check for timeout issues or weak handoffs between the app, OS-level security prompts, and backend authentication services.
Example: ABANCA (a Spanish retail bank) introduced ABANCA Key, a passkey-based authentication service used by more than 42% of its customers. The bank reports over 11 million high-risk transactions protected with no technical or service incidents, showing that authentication can hit <0.1% benchmark reliability at massive scale.
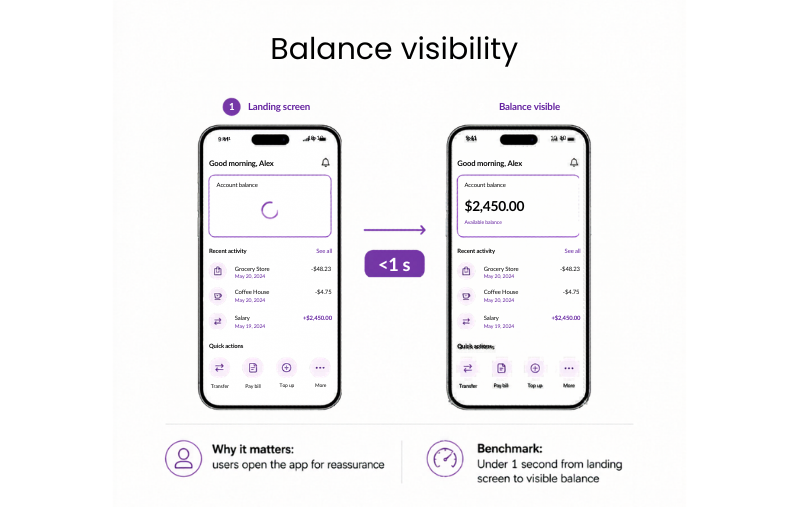
#20: Login to balance visible
Once the dashboard loads, the key question is how quickly the account balance becomes visible.
Why it matters: For most users, the account balance is the main reason to open the app. If the interface loads but the balance keeps spinning, the app feels slow and less reliable at exactly the moment users expect reassurance.
Benchmark: Under 1 second from landing screen to visible balance
If underperforming:
- Start the balance request in parallel with the final stage of authentication.
- Show the last known balance immediately with a syncing indicator.
- Prioritize balance data over secondary dashboard elements.
#21: Quote refresh latency
Quote refresh latency is the time between a market price change and the updated quote appearing in the app.
Why it matters: If quotes lag behind the market, users stop trusting the data they see and hesitate to act on it.
Benchmark: Under 500 ms for updates during active market hours
If underperforming:
- Replace polling with streaming where possible.
- Prioritize the fastest updates for the most volatile assets.
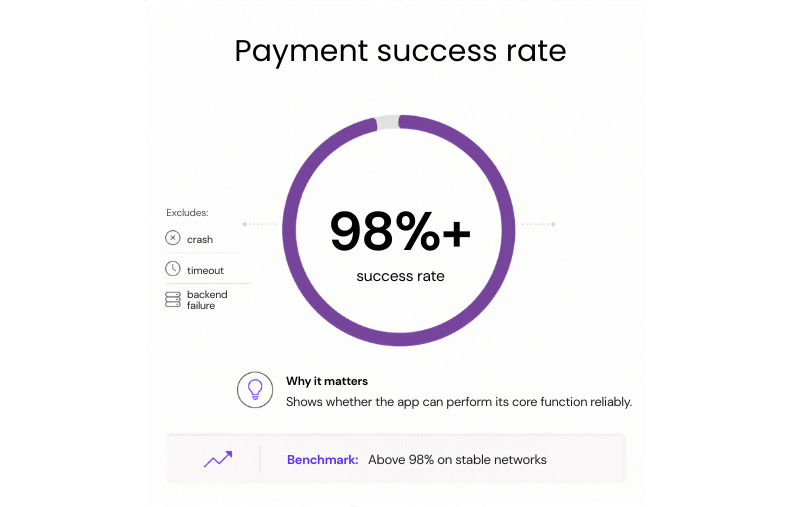
#22: Payment success rate
The key measure here is the share of initiated payments that reach a final success state without a crash, timeout, or failed backend response.
Why it matters: Payment success rate is one of the clearest indicators of whether a fintech app can perform its core function reliably.
Benchmark: Above 98% on stable networks
If underperforming: Fix timeouts and retries first, so a failed connection doesn’t stop the payment or charge the user twice.
Example: Canva was losing out on some payments due to network interruptions and declined transactions. With Stripe’s real-time retries and optimized routing, the company managed to improve its payment success rate by 2.1%, moving the flow closer to the above-98% benchmark.
#23: Drop-offs per step in payment flow
The focus here is how many users leave at each stage of the payment journey, such as amount entry, confirmation, authentication, or processing, rather than across the flow as a whole.
Why it matters: Step-level data shows where the transaction is actually being lost, which makes it easier to fix the right screen or delay.
Benchmark: Under 5% drop-off per step on critical payment flows
If underperforming:
- Start with the step where abandonment is highest.
- Check whether the cause is speed, unclear UI, or unnecessary friction.
#24: Time to complete a transfer or order execution
This metric covers the full transfer window, from tapping Send to seeing the final confirmation that the transfer has been processed.
Why it matters: Long transfer times create hesitation, repeated taps, and support requests because users are no longer sure whether the money actually moved.
Benchmark: Under 3 seconds for the full request-response cycle
If underperforming: Review the transfer path for blocking backend checks, especially validations or third-party calls that delay confirmation.
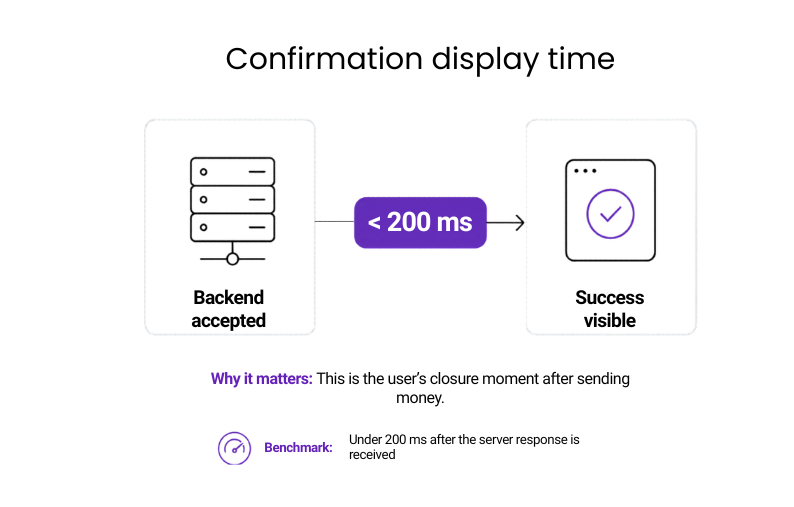
#25: Time to show transaction confirmation
Once the backend accepts the transaction, the confirmation should appear straight away. What is measured here is the gap between the successful server response and the visible success state in the app.
Why it matters: This is the moment that gives users closure. If the money is sent but the app takes too long to confirm it, the experience feels unreliable and disconnected from the transaction itself.
Benchmark: Under 200 ms after the server response is received
If underperforming:
- Keep the confirmation state lightweight.
- Render it immediately after the backend response, without waiting for extra API calls.
Example: BioCatch, a behavioral biometrics platform integrated into mobile banking apps, detects fraud in under 200ms by analyzing 3,000 behavioral and device signals in real time, stopping suspicious payments before funds leave customer accounts.
#26: Time to show updated balance
After a payment or transfer is confirmed, the balance should reflect the change without delay. The gap between transaction confirmation and the updated balance is a direct test of whether the app feels current and trustworthy.
Why it matters: If the transaction is marked as complete but the balance stays unchanged, users start to question whether the payment really went through.
Benchmark: Under 2 seconds after transaction confirmation
If underperforming:
- Refresh the balance immediately after transaction confirmation.
- Show an interim synced state if the final update takes longer.
#27: Fraud detection timing
Every payment and transfer passes through fraud checks before it completes. This metric tracks how long those checks take, and how much latency they add to the user-facing flow.
Why it matters: If fraud controls are too slow, the app starts to feel blocked by its own security.
Benchmark: Fraud-related checks should add minimal visible delay to login or payment flows
If underperforming: Move non-blocking fraud checks out of the critical path so only essential controls delay the user flow.
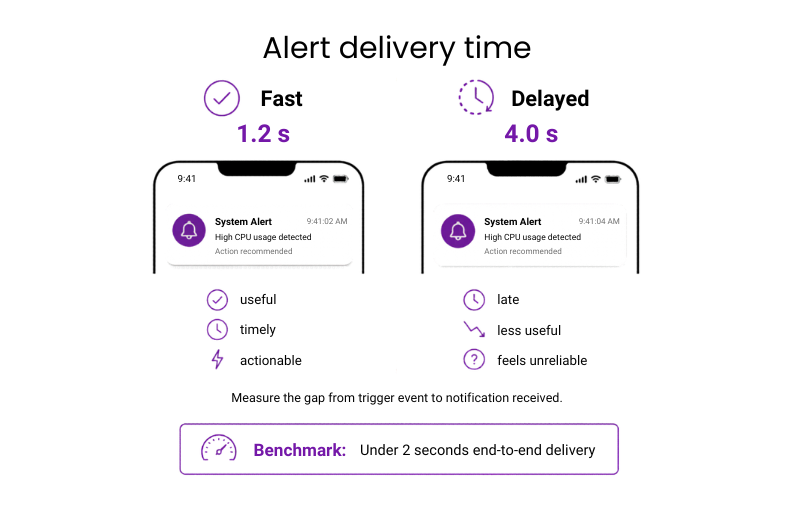
#28: Alert delivery time
Alert delivery time measures the interval between a trigger event and the moment the user receives the notification.
Why it matters: Alerts only work if they arrive in time to be useful. Once delivery is delayed, a warning becomes a report.
Benchmark: Under 2 seconds end-to-end delivery
If underperforming:
- Review queue delays first.
- Then streamline payload creation for high-priority alerts.
#29: Scalability during peak events
This checks whether the app stays fast, stable, and reliable during spikes such as during payday, month-end, or fast-moving market events.
Why it matters: Under peak load, small slowdowns disrupt large volumes of transactions at once, driving failed actions, support spikes, and operational strain.
Benchmark: Core flows should maintain normal success rates and acceptable response times during known traffic spikes
If underperforming:
- Stress-test core flows under peak load.
- Fix the bottlenecks that slow payments, login, or balance updates first.
Example: IKO, the app of PKO Bank Polski, processes more than 32 million interactions every day and 361 transfers per minute. To handle busy periods, the bank strengthened its infrastructure with Kubernetes on Google Cloud, after traffic on peak days reached up to three times the average number of users. This shows why a mobile banking application needs to have a scalable infrastructure to manage any jumps in traffic without slowing key flows.
#30: 3rd-party SLA latency and retry success rates
The focus here is how much delay third-party services add to key flows, and how often retries succeed when those services time out or fail.
Why it matters: It makes external bottlenecks visible before they spread into wider product issues.
Benchmark: Third-party services should stay within agreed response times, with high retry success on temporary failures
If underperforming:
- Review the slowest dependencies first.
- Add stronger fallback or retry handling around them.
Investing and trading
In investment and trading apps, performance is measured by how quickly the platform reflects market changes, executes actions, and updates portfolio data.
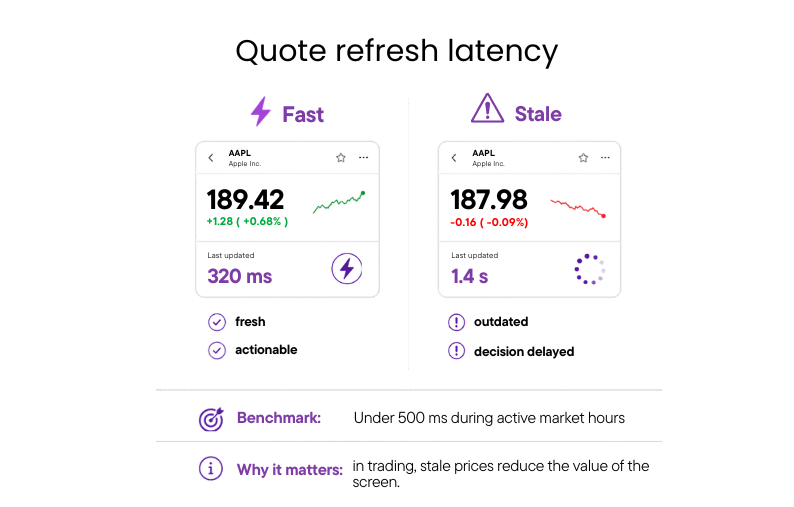
#31: Quote refresh latency
Quote refresh latency is the time between a market price change and the updated quote appearing in the app.
Why it matters: In trading, stale prices reduce the value of the screen and delay decision-making.
Benchmark: Under 500 ms during active market hours
If underperforming:
- Replace polling with streaming where possible.
- Prioritize updates for the most volatile assets.
#32: Time to complete an order execution
The full window runs from tapping Buy or Sell to seeing confirmation that the order has been accepted or executed.
Why it matters: In fast markets, execution speed determines whether the platform can support timely trading and stay competitive when seconds matter.
Benchmark: Under 3 seconds for standard market orders
If underperforming:
- Remove blocking checks from the execution path.
- Review which backend steps delay confirmation.
#33: Time to show updated portfolio value
This metric runs from order execution to the moment the updated portfolio value appears on screen.
Why it matters: Until the new value appears, the platform is showing outdated portfolio data.
Benchmark: Under 2 seconds after order execution
If underperforming:
- Trigger the portfolio refresh immediately after execution.
- Show a clearly marked interim state until final values load.
AI app performance benchmarks
AI features raise the performance bar because users judge them not just by accuracy, but by how quickly and smoothly they respond in real use.
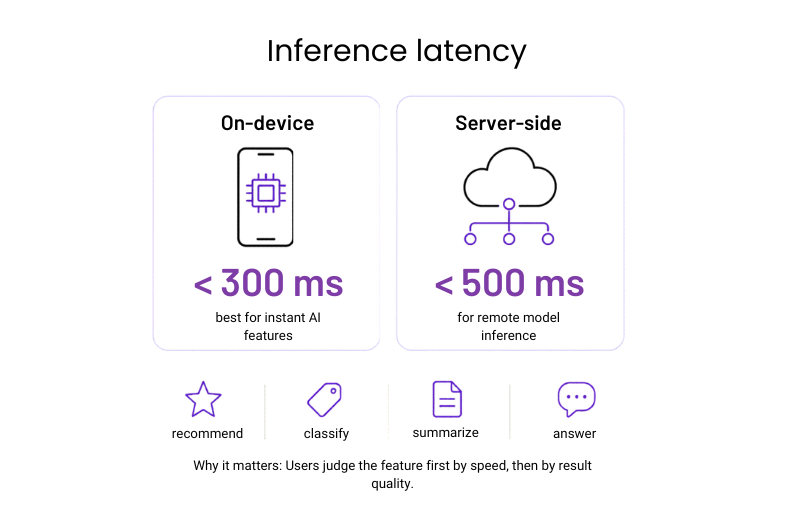
#34: Inference latency
Inference latency covers the time it takes for an AI feature to return a result after the user triggers it. In mobile apps, that could mean generating a recommendation, classifying an image, summarizing text, or answering a prompt.
Why it matters: Users judge the feature first by how quickly it responds, and only then by the quality of the result.
Benchmark: Under 300 ms for on-device inference and 500 ms for server-side inference
If underperforming: Reduce model size or move non-critical processing out of the blocking path so the user gets a result faster.
#35: Time to first token
For generative AI features, the interval starts when the user submits a prompt and ends when the first visible output appears.
Why it matters: Users are far more tolerant of a longer response if the app starts answering immediately. If nothing appears for too long, the feature feels broken or disconnected.
Benchmark: First token visible in under 500 ms where possible
If underperforming: Stream output as soon as generation begins instead of waiting for the full response to complete.
#36: Fallback rate
Fallback rate measures how often the feature fails and drops back to a non-AI path, simplified output, or generic response.
Why it matters: A high fallback rate means the feature is less reliable than it appears. Even if the app avoids crashing, users will quickly notice when the AI works inconsistently.
Benchmark: Fallbacks should remain rare and should not interrupt the core flow
If underperforming:
- Review failure causes first, especially timeouts, model overload, and unsupported edge cases.
- Then tighten the fallback logic around those points.
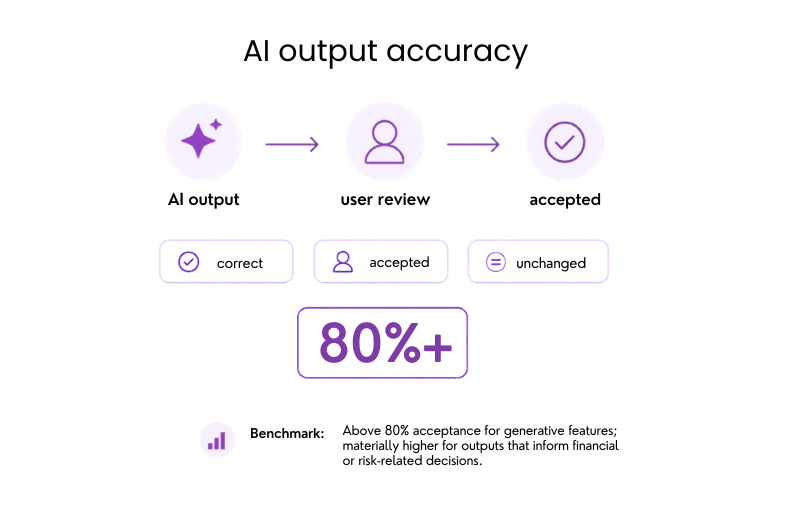
#37: AI response accuracy rate
The most useful indicator here is how often AI outputs are correct, accepted by the user, or left unchanged.
Why it matters: Accuracy is what turns AI from a novelty into a feature users can trust.
Benchmark: Above 80% acceptance for generative features; materially higher for outputs that inform financial or risk-related decisions
If underperforming: Break performance down by query type, use case, or user segment before changing the model, because accuracy problems are usually concentrated in narrower scenarios.
Example: Munich Re, one of the world’s largest reinsurance companies, reports more than 90% accuracy on AI-generated answers in insurance queries, proving that domain-specific AI attributes can achieve accurate results when trained correctly.
Need more guidance? Use a mobile app testing checklist to make sure performance benchmarks are validated alongside functionality, security, compatibility, and accessibility
Engineering and operations metrics
These are the internal metrics behind mobile app performance benchmarks. While users never see them directly, they strongly influence whether speed, stability, and responsiveness hold up in real use.
#38: Requests per screen
This refers to the number of API calls made when a screen is loaded.
Why it matters: This shows how efficiently a screen is built. Fewer requests usually mean faster load times, lower backend demand, and fewer points of failure.
Benchmark: As few as the screen genuinely requires; more than five requests on a single screen is worth reviewing
If underperforming:
- Audit each screen’s network activity.
- Consolidate calls where possible.
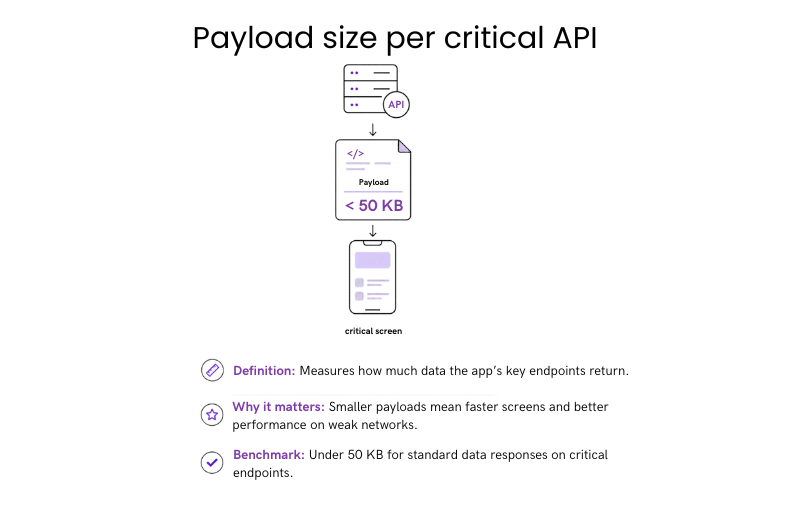
#39: Payload size per critical API
Payload size per critical API refers to how much data is returned by the app’s most important endpoints.
Why it matters: Response size directly affects how quickly critical data moves through the product. Smaller payloads support faster screens and more consistent performance across network conditions.
Benchmark: Under 50 KB for standard data responses on critical endpoints.
If underperforming: Remove unused fields and introduce pagination or partial responses for larger datasets.
#40: Cache hit rate
Cache hit rate is the share of data requests served from cache instead of a live network call.
Why it matters: A strong result here improves speed, reduces backend demand, and makes performance less dependent on network quality.
Benchmark: Above 80% for static or slowly changing content; higher for assets like images and configuration data.
If underperforming:
- Review cache expiry rules.
- Strengthen caching on the highest-traffic endpoints first.
Example: Pinterest’s image and asset caching consistently exceeds 90% hit rates. They achieved it by prioritizing cache coverage on their highest-traffic content endpoints first.
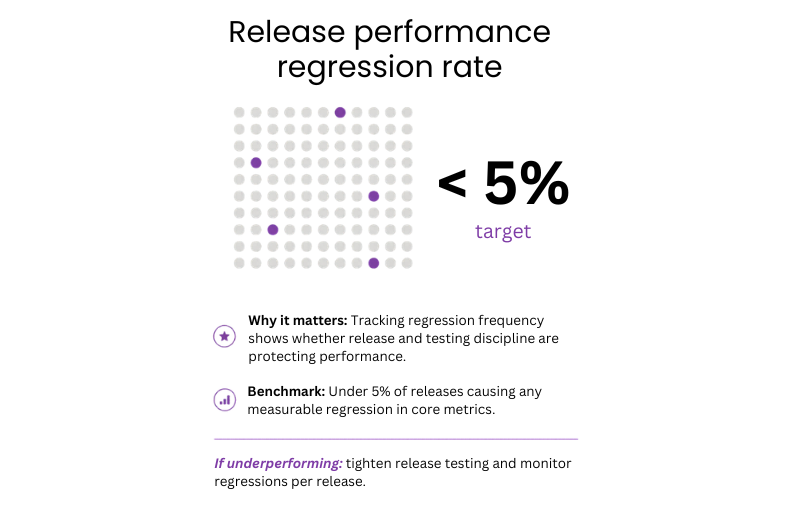
#41: Performance regression rate
This metric tracks how many app releases introduce a measurable decline in a core performance metric.
Why it matters: Every release is a risk. Tracking how often that risk materialises shows whether the team’s release and testing process is keeping pace with development speed.
Benchmark: Fewer than 5% of releases should cause a measurable regression in core performance metrics.
If underperforming:
- Add automated performance checks to CI/CD.
- Block releases that break agreed performance budgets.


Build mobile apps that are fast, stable, and built to last
From first concept to production-ready product – Neontri delivers mobile experiences your users will trust and return to.

Build a high-performing mobile app with Neontri
We’ve been building mobile banking and fintech products for over 15 years. With 100+ banking solutions delivered for leading European banks, our proprietary Enterprise Application Framework (NEAF), and long-term partnerships with institutions handling millions of daily transactions, Neontri brings the discipline needed to meet these benchmarks in every release.
Here are examples of how we created products trusted by millions of users every day:
- IKO, the world’s best mobile banking app: Neontri built the core framework behind PKO Bank Polski’s IKO app, which today serves 8 million users, processes 32 million daily interactions, and handles 361 transfers per minute. Named the best mobile banking app in the world for two consecutive years by Retail Banker International, ahead of JP Morgan Chase, Barclays, and Bank of America.
- Data Hub, innovative offloading system: Built for PKO Bank Polski, Data Hub handles 10,000 requests per second and supports near-real-time replication. When digital growth put pressure on the bank’s legacy systems, Neontri created an offloading layer that captures and replicates data changes across a distributed architecture spanning three data centers.
- Full mobile banking app launched in under 12 months: A financial institution needed a secure, scalable mobile banking platform ready for multi-country expansion. Using NEAF’s pre-built components and security features, Neontri built a feature-rich production app in less than a year.
Need a mobile app that meets real banking performance benchmarks? We can build a secure, scalable product or audit your existing app to find performance gaps and optimization opportunities. Schedule a free call with our expert.
Conclusion
How well the app performs has an influence on user retention, trust, and how easily people can complete important tasks. The benchmarks in this guide show when delays start to change user behavior, as a result of which, more people leave, and trust in your product decreases. Even small slowdowns can add up when users rely on your app every day.
Teams that keep an eye on performance all the time, not just before launching, tend to create a more robust product over time. Apps that run faster are more user-friendly, receive higher ratings, and are less likely to be swapped out.