

Mobile apps have become the backbone of the digital economy, generating $167 billion in consumer spending in 2025 alone, with users devoting an average of 3.6 hours every day inside them.
From AI assistants and social platforms to mobile payments, apps now shape how billions of people work, shop, and connect.
In this report, you will find the most up-to-date mobile app statistics covering:
- Market size
- Downloads
- Revenue
- Usage trends
- Platform comparisons
- Future trends
Highlights and key statistics
Here are the key statistics that highlight the most relevant trends in mobile apps:
- The global app market is worth $298 billion and will cross $1 trillion by 2034.
- Users spent $167 billion on apps in 2025 – roughly $318,000 every minute.
- The average person spends 3.6 hours a day inside mobile apps.
- More than 50% of all internet traffic now comes from mobile devices.
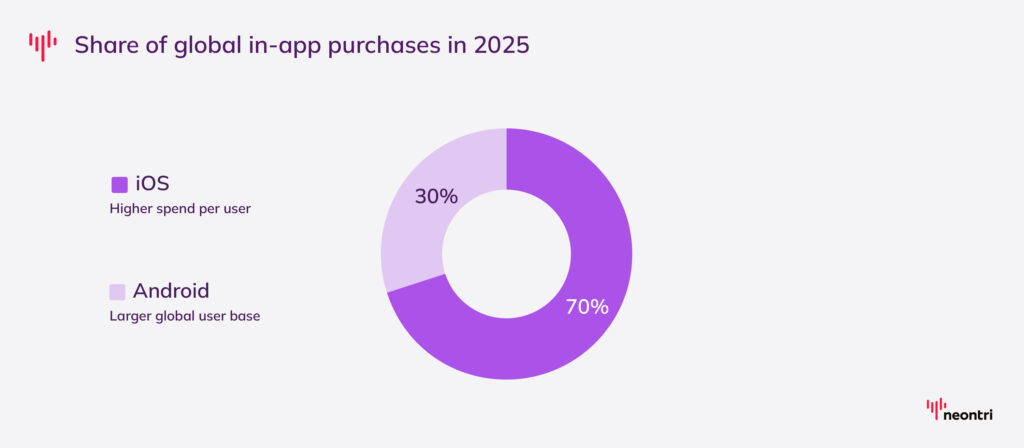
- iOS generates 70% of all app revenue, despite Android having far more users.
- US consumers alone spent $55.5 billion on apps last year, up 18%.
- Non-gaming apps outsold games for the first time ever in 2025.
- Subscriptions now account for 96% of all money spent inside apps.
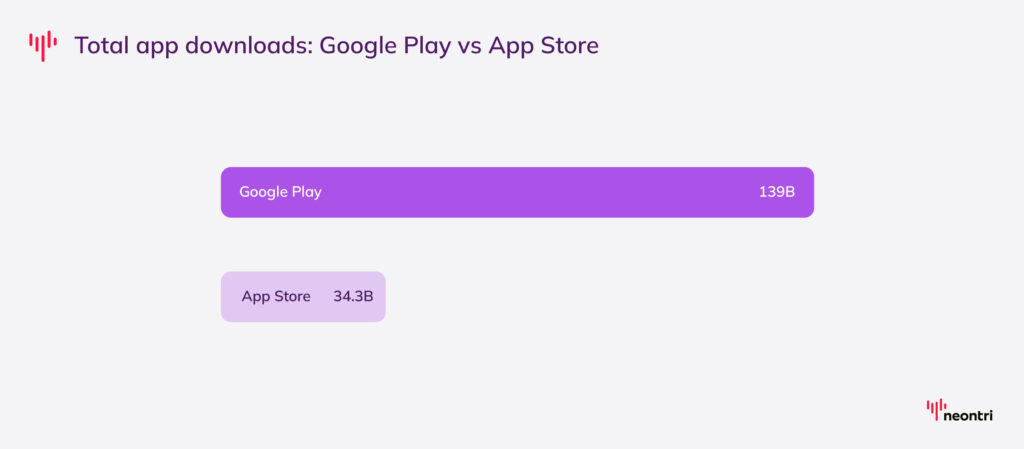
- Google Play recorded 139 billion downloads in 2025; more than 4x the App Store.
- Apple’s App Store earned nearly twice as much revenue as Google Play.
- Games make up nearly a third of all app downloads worldwide.
- The typical app loses 95% of its users within the first 30 days.
- ChatGPT became the most downloaded app on the planet in 2025, ahead of Instagram and TikTok.
- Time spent in AI apps grew more than 5 times over in a single year.
- By 2030, Asia is expected to claim 70% of the global app download market.
Market growth drivers
Several forces are driving mobile app market growth and the numbers behind them can’t be ignored.
#1: There are more than 7 billion smartphones in use worldwide
With the global population now at around 8.3 billion, smartphones are in the hands of most people worldwide.
In many developed markets, smartphone penetration is already above 90%, which makes mobile the primary digital platform.
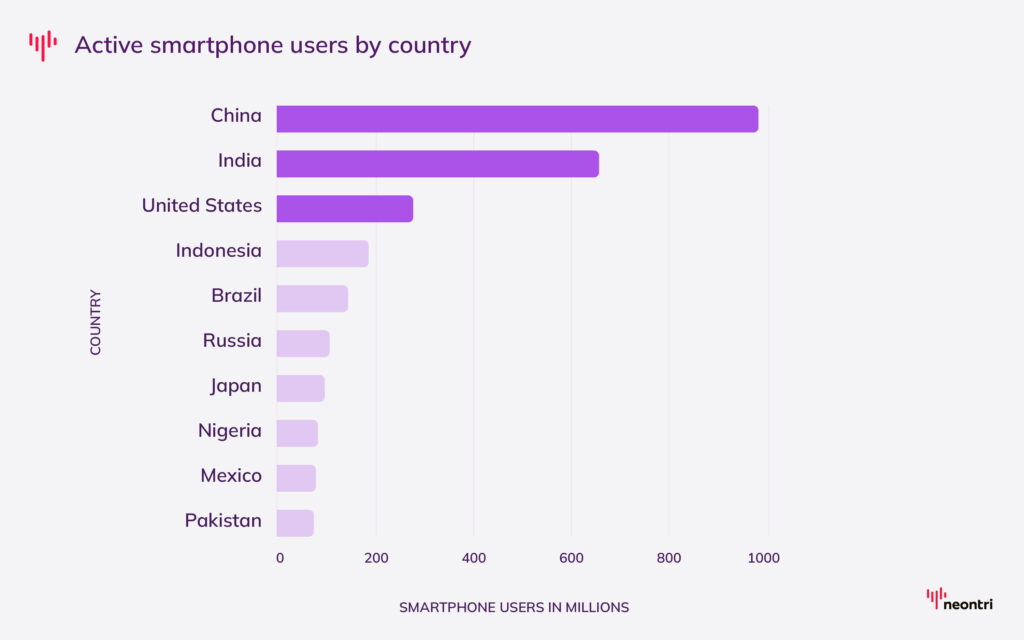
#2: China leads the world with 975 million active smartphone users
With close to 1 billion active smartphone users, China dwarfs every other market, having 1.5x more users than India, and more than 3x the United States.
Yet the most surprising part is how much room remains. China’s penetration sits at just 68.4%, while the US has already reached 81.6%. Markets like India (46.5%) and Nigeria (38.1%) are still in early stages.
#3: More than half of internet users now go online through mobile devices
In December 2025, 54% of consumers worldwide used mobile devices to access the internet. In North America, the figure was almost the same at 53%.
This confirms that mobile remains the main way people connect, browse, and use digital services in everyday life.
#4: Global mobile subscriptions have reached 8.9 billion
Mobile connectivity already spans close to 9 billion subscriptions worldwide, powering always-on app usage across emerging economies
According to the Ericsson Mobility Report, that number is set to grow by another 500 million over the next few years, reaching more than 9.4 billion by 2030.
#5: Generative AI apps are becoming a major force in mobile
AI is now built into a growing number of everyday apps. In the first half of 2025 alone, users downloaded generative AI apps 1.7 billion times and spent $1.9 billion on in-app purchases, making the category one of the fastest-rising segments in mobile.
#6: 5G networks carried 43% of mobile data traffic by end-2025
Nearly half of global mobile data traffic already runs on 5G, and that share is expected to reach 80% by 2030.
As coverage expands, 5G will play a bigger role in how people stream, browse, and use apps on their phones. It will also support more advanced experiences, including AR/VR, cloud gaming, and real-time features that were far more limited on 4G.
Market size, spending, and monetization
Smartphone growth and mobile connectivity tell only part of the story. To see where the app market is heading, look at revenue, regional leaders, and monetization trends.
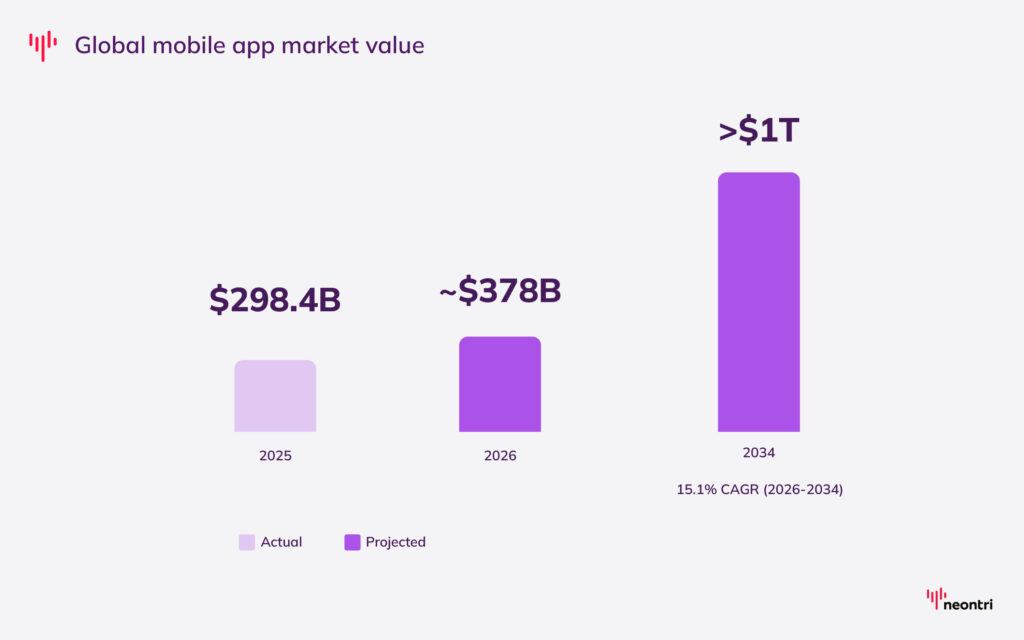
#7: Global mobile app market will reach $378 billion by the end of 2026
The mobile app market keeps expanding as app-based services become more common and smartphone use continues to rise worldwide.
Its total value reached $298.4 billion in 2025 and is expected to grow by another 26.7% in 2026, reaching nearly $400 billion.
Long-term forecasts put the market above $1 trillion by 2034, growing at 15.1% per year and more than tripling in under a decade.
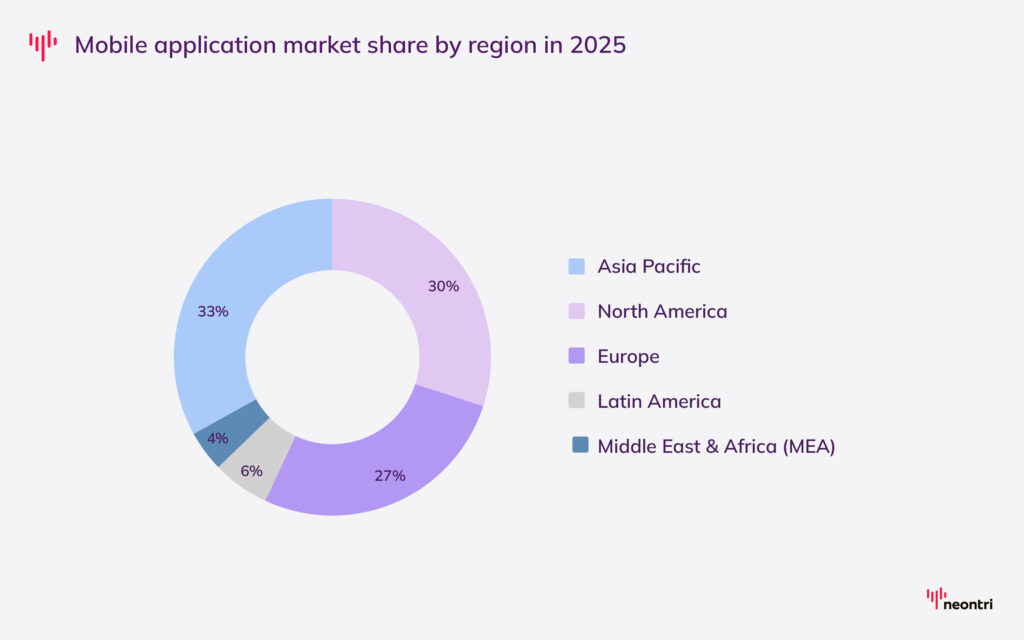
#8: Asia Pacific dominates with a 33% share of the total mobile app market
Asia Pacific is the largest regional market, with roughly one-third of global share. It ranks ahead of:
- North America (30%)
- Europe (27%)
- Latin America (6%)
- The Middle East & Africa (4%)
The region’s lead comes from its large and growing mobile user base, while North America remains close behind thanks to much higher average revenue per user.
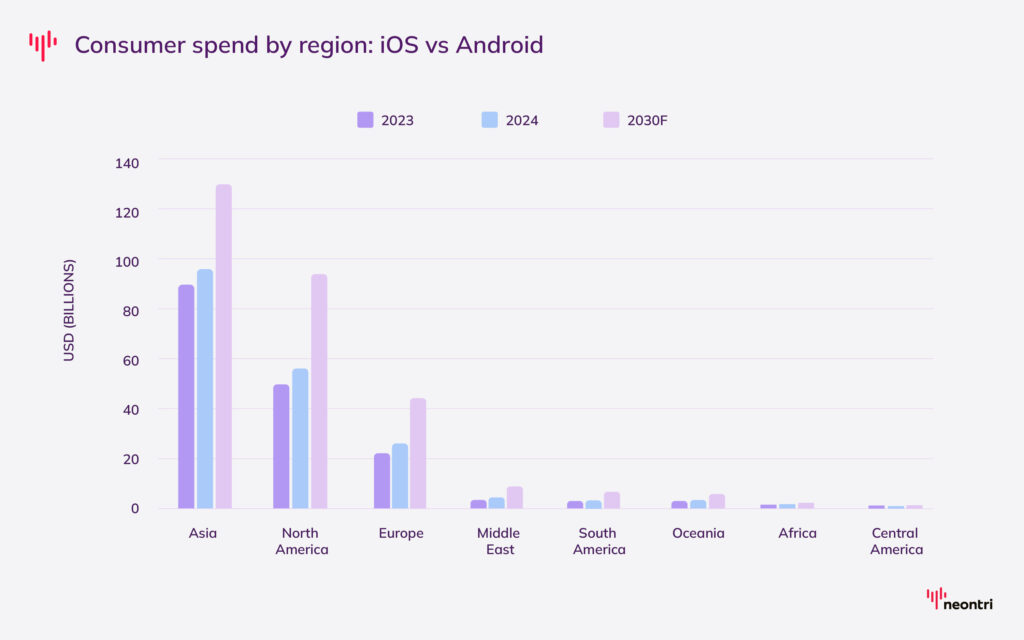
#9: Asia, North America, and Europe are set to generate 92% of global app spending in 2030
Asia ($130.1 billion), North America ($92.2 billion), and Europe ($43.8 billion) are projected to see a combined $266 billion in consumer spend across iOS and Android in 2030.
These three regions will remain well ahead of the rest, although their share is expected to edge down from 94% in 2023 as smaller markets expand more quickly.
Central America is forecast to post the fastest growth, followed by South America, Africa, and the Middle East
Note: These numbers cover iOS, Google Play, and third-party Android stores in China.
#10: Consumer spending on apps and games reached $167 billion in 2025
In 2025, users spent roughly $318,000 every minute across iOS and Google Play. That’s an 11.1% jump from the previous year.
The growth is particularly striking given that the market was already considered mature, showing that users are not just downloading more apps, but increasingly willing to pay for them.
#11: iOS generated 70% of all global app consumer spending
Despite Android having a larger worldwide user base, Apple’s iOS was responsible for 70% of total app consumer spending in 2025.
iPhone users consistently spend more on apps and subscriptions, making iOS the priority platform for any developer focused on revenue.
#12: US consumers spent more than $55 billion on apps in 2025
The United States remains the most valuable single market for app revenue, with consumer spending jumping 18% year-over-year to $55.5 billion in 2025.
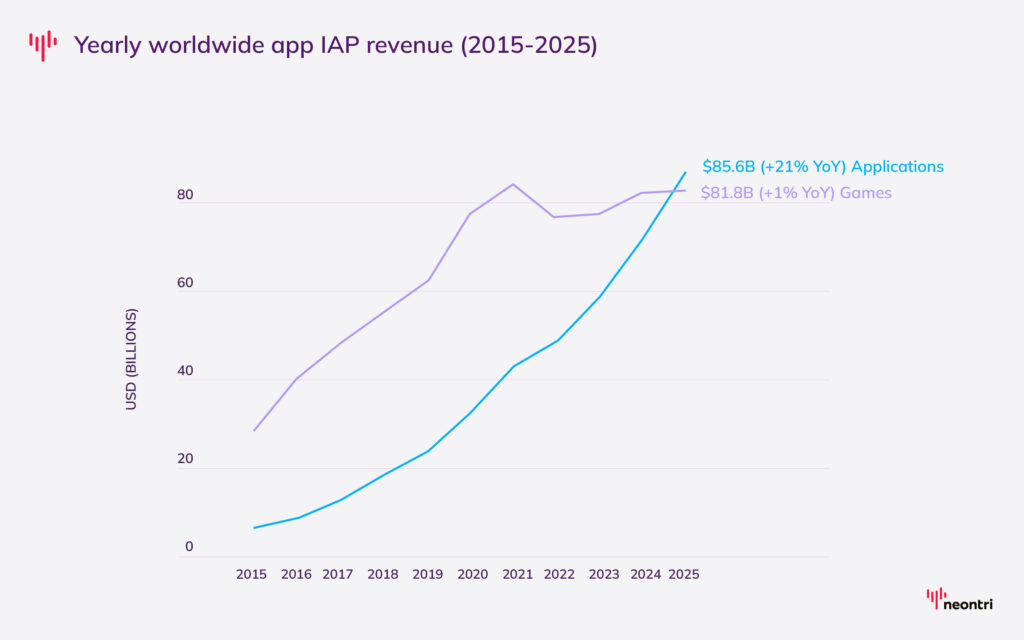
#13: Non-gaming apps brought in $85 billion in 2025, beating games for the first time
Consumers spent a combined $167.4 billion on non-gaming apps and games in 2025. Of that, $85.6 billion went to non-gaming apps, compared with $81.8 billion for games. Year over year, spending on apps increased by 21%, while games saw just 1% growth.
As reported in Sensor Tower’s State of Mobile 2026, generative AI helped drive that increase, but growth was visible across most app categories.
Note: Figures combine iOS and Google Play, with iOS only for China. The numbers show gross spending, before app store fees are deducted.
#14: Subscriptions now drive 96% of all app spending on iOS and Google Play
Subscriptions have become the dominant revenue model, accounting for 96% of every dollar spent by consumers across both major app stores.
For developers, this means recurring, predictable income, and for users, paying monthly rather than once.
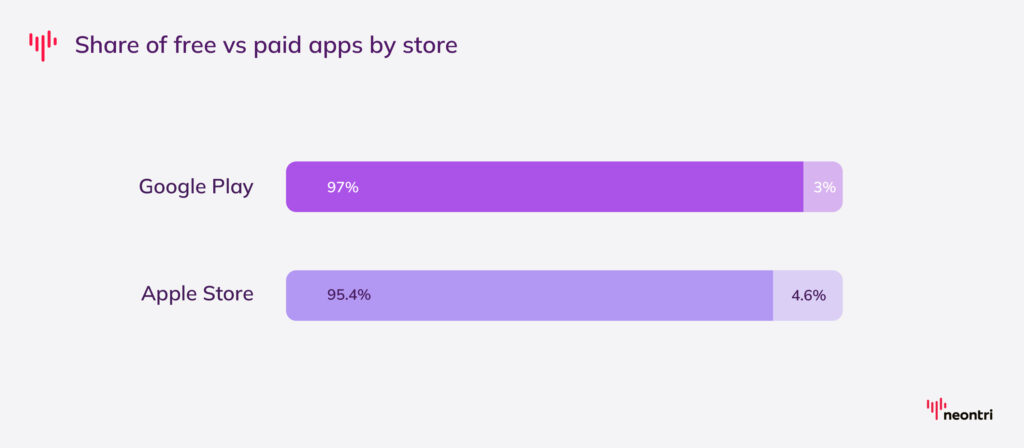
#15: 95.4% of apps are free
Free apps dominate both app stores. About 97% of Google Play apps and 95.4% of App Store apps are free to download. Many still earn revenue through ads, in-app purchases, and subscriptions.
#16: 35% of apps now combine subscriptions with other revenue models
Subscriptions still dominate app monetization, but more publishers are diversifying.
More than one third of apps now combine subscriptions with consumables or lifetime purchases, showing that hybrid monetization is becoming more common.
#17: Free trials of at least 5 days drive higher subscription conversions
Trial length has a clear impact on conversion, but only up to a point. Apps offering trials of 4 days or fewer see a median conversion rate of 30%, while those offering 5 days or more jump to around 45%, regardless of whether the trial runs for a week or a month.
iOS vs Android statistics
See how the two leading mobile platforms compare across key market and revenue metrics.
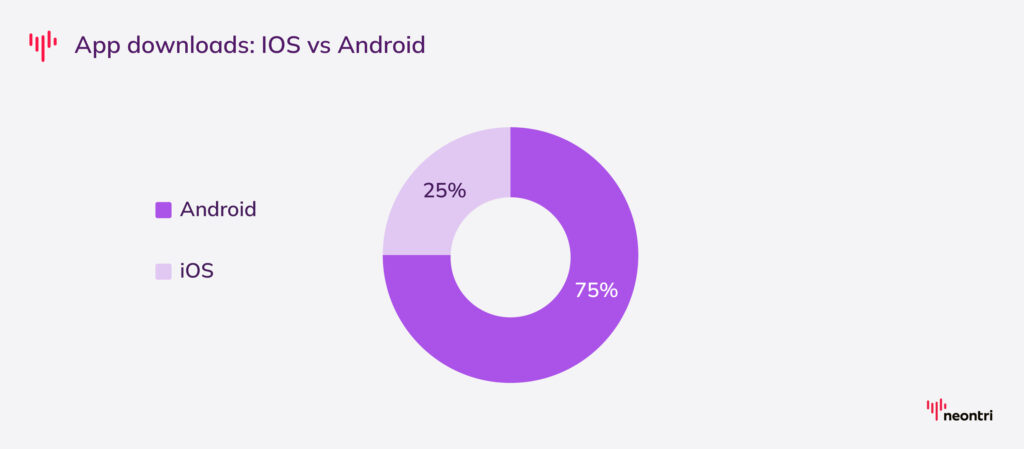
#18: Android leads in downloads, but iOS brings in far more revenue per user
Android accounts for 75% of app downloads, compared with 25% for iOS, which shows its much broader global reach.
#19: iOS generates nearly 3x more revenue per user than Android
While Android leads in scale, iOS performs much better in monetization. Based on market data from 2024–2025, average revenue per user reaches $101 on iOS, well ahead of $38 on Android, highlighting the stronger spending power of Apple users.
App Store vs Google Play statistics
While both are strong, the App Store and Google Play differ in scale, user spending, and revenue potential. See how they compare across the metrics that matter most.
#20: Google Play and the App Store now offer more than 4 million apps combined
The two biggest app marketplaces currently list around 2.19 million apps on Google Play and 2.1 million on the Apple App Store.
While both platforms have trimmed older, low-quality apps in recent years, the overall catalogue remains massive. This suggests the market is becoming more selective, not smaller, with quality and discoverability taking priority over sheer volume.
#21: Google Play led app downloads in 2025, while the App Store remained stronger in value
Google Play recorded 139 billion downloads in 2025, compared with 34.3 billion on the App Store.
That gap shows Android’s much wider overall presence. At the same time, App Store growth was slower, pointing to a platform that competes less on volume and more on user spending.
#22: The App Store generates nearly twice the revenue of Google Play despite fewer downloads
Apple’s App Store brought in an estimated $123 billion in 2025 compared to $78 billion for Google Play.
#23: Games were the most popular app type on both app stores in 2025
Gaming dominated downloads on both platforms, reaching 21.17 billion downloads on Google Play and 7.37 billion on the App Store.
Beyond gaming, Entertainment (8.09 billion) and Finance (6 billion) ranked next on Google Play, while Business (1.12 billion) and Education (1.06 billion) followed on the App Store.
| Google Play top categories | Downloads (billions) | App Store top categories | Downloads (billions) |
|---|---|---|---|
| Games | 27.17B | Games | 7.37B |
| Entertainment | 8.09B | Entertainment | 1.96B |
| Finance | 6.00B | Business | 1.12B |
| Shopping | 5.35B | Education | 1.06B |
| Productivity | 5.31B | Lifestyle | 0.88B |
| Social | 4.22B | Finance | 0.58B |
| Tools | 3.99B | Shopping | 0.51B |
| Communication | 3.47B | Social | 0.47B |
| Lifestyle | 2.36B | Books | 0.26B |
| Video Players | 2.01B | Health & Fitness | 0.26B |
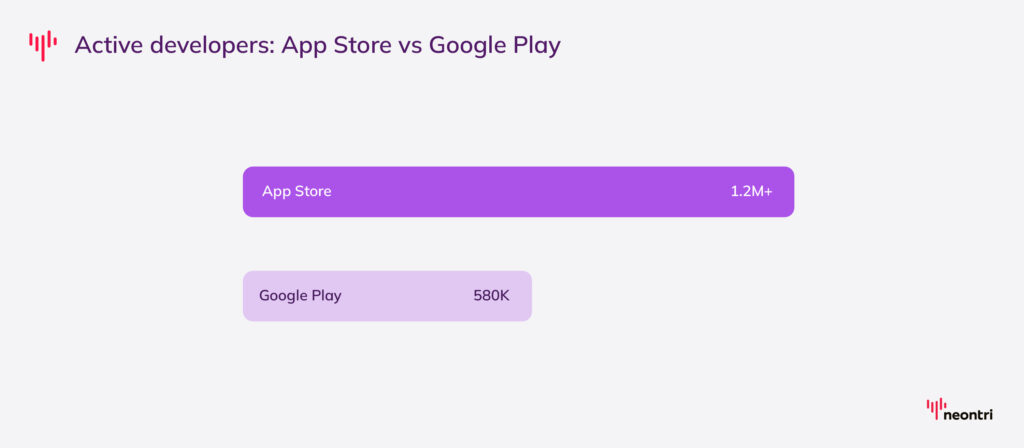
#24: The App Store has more than twice as many active developers as Google Play
Apple’s marketplace counts over 1.2 million active developers, compared with 580,876 on Google Play.
Mobile app usage and time spent
App usage patterns show where consumer attention is going. Check out how much time users spend in apps and which categories keep them engaged the most.
#25: Consumers spent 5.3 trillion hours in mobile apps across 2025
The average user spent more than 600 hours in apps over the course of the year.
On a daily basis, that came to 3.6 hours, up 3.8% from 2024. Apps such as Google, YouTube, and Chrome remained among the biggest drivers of monthly engagement.
Note: This excludes third-party Android in China and other markets.
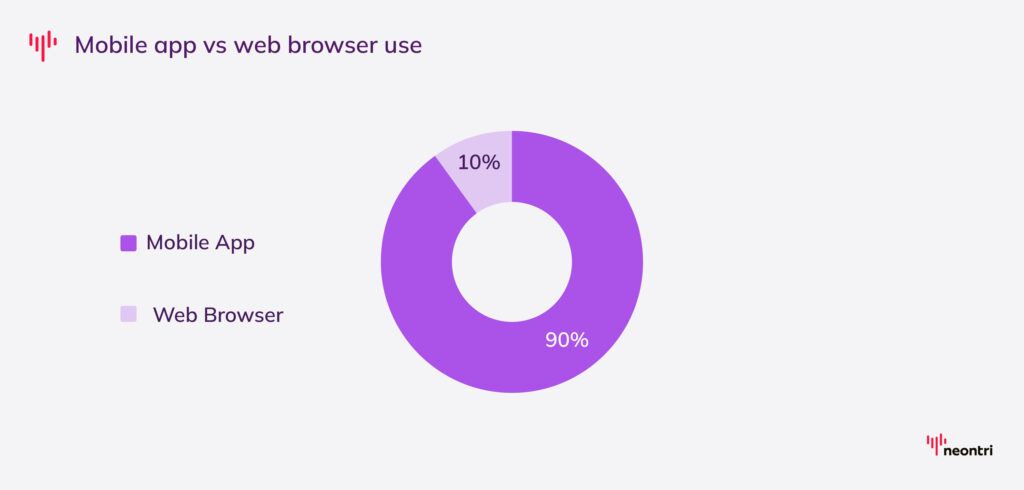
#26: Users are 4.2x more active in mobile apps than on mobile browsers
Apps account for nearly 90% of all mobile time. The gap highlights why a mobile-friendly website is no longer enough on its own
Because they store data locally, apps typically load 2–3x faster than websites, offering a faster and more personalized experience for everyday use.
#27: The average user taps into 10 different apps a day
Across 80 iOS and Android markets (excluding China) people now interact with around 34 apps every month.
The figure is 5.4% higher than a year earlier, which suggests that app use is spreading across a wider mix of platforms.
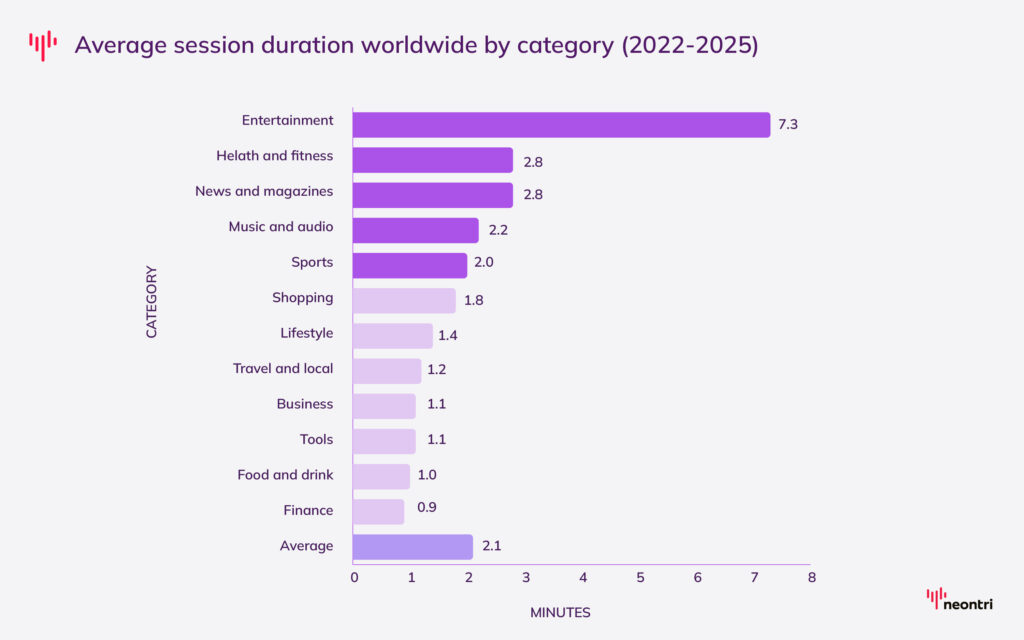
#28: Entertainment apps hold users’ attention longer than any other category
Among US users, entertainment apps record the longest average session time at 7.3 minutes.
That is well ahead of the next closest categories, with both health & fitness and news & magazines averaging 2.8 minutes per session, followed by music & audio at 2.2 minutes. The overall average across all categories sits at 2.1 minutes.
Note: Apps with more than 100K monthly active users are included in the overall average.
#29: People devoted more than 90 minutes a day on social platforms in 2025
Mobile users spent nearly 2.5 trillion hours on social media apps in 2025.
Time spent across iOS and Android was 5% higher than in 2024, even as overall mobile use began to level out after years of rapid growth.
#30: YouTube leads social apps by monthly time spent
In 2025, users spent an average of 11 hours and 32 minutes per month on YouTube. That put it ahead of TikTok, Facebook, Telegram, and Instagram, making YouTube the most time-consuming app in the social category.
| App | Average monthly time spent (hours) |
|---|---|
| YouTube | 11.32 |
| TikTok | 9.05 |
| 5.15 | |
| Telegram | 4.54 |
| 4.41 | |
| 4.34 | |
| 4.02 | |
| X (Twitter) | 4.01 |
| Threads | 3.00 |
| Discord | 2.29 |
| Snapchat | 2.14 |
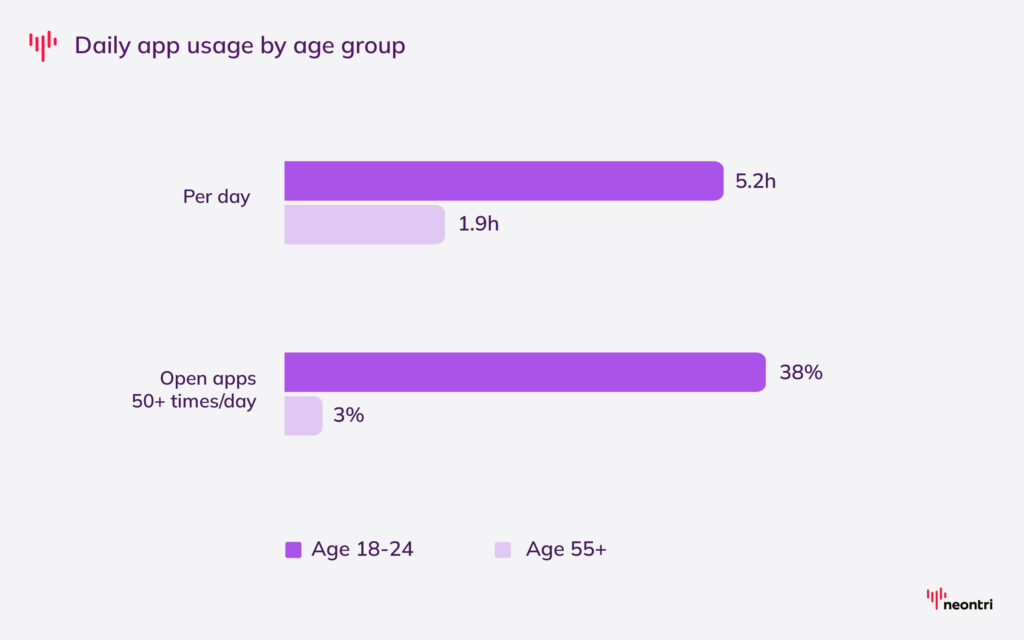
#31: Gen Z spends nearly 3 times more time in apps than users aged 55+
Among users aged 18 to 24, average app use reaches 5.2 hours a day, compared with 1.9 hours for people aged 55 and older.
Gen Z also shows much heavier engagement, with 38% opening apps more than 50 times a day, versus just 3% in the oldest group.
#32: Younger adults are more likely than older users to pay for app subscriptions
Among mobile users aged 18 to 29, 77% have at least one paid subscription accessed through an app. For users aged 65 and older, that figure falls to 44%.
At the same time, the 30-44 group appears to be the heaviest subscribers, with 15% reporting 6 or more paid app subscriptions, compared with 4% of those aged 18-29.
Mobile app downloads statistics
To see how the app market is expanding across regions and categories, take a look at the download trends below.
#33: New app downloads reached 149 billion in 2025
Users downloaded around 284,000 apps every minute across iOS and Google Play.
Compared with 2024, the total rose by 0.8%, suggesting that the market is still expanding, but at a steadier pace than before.
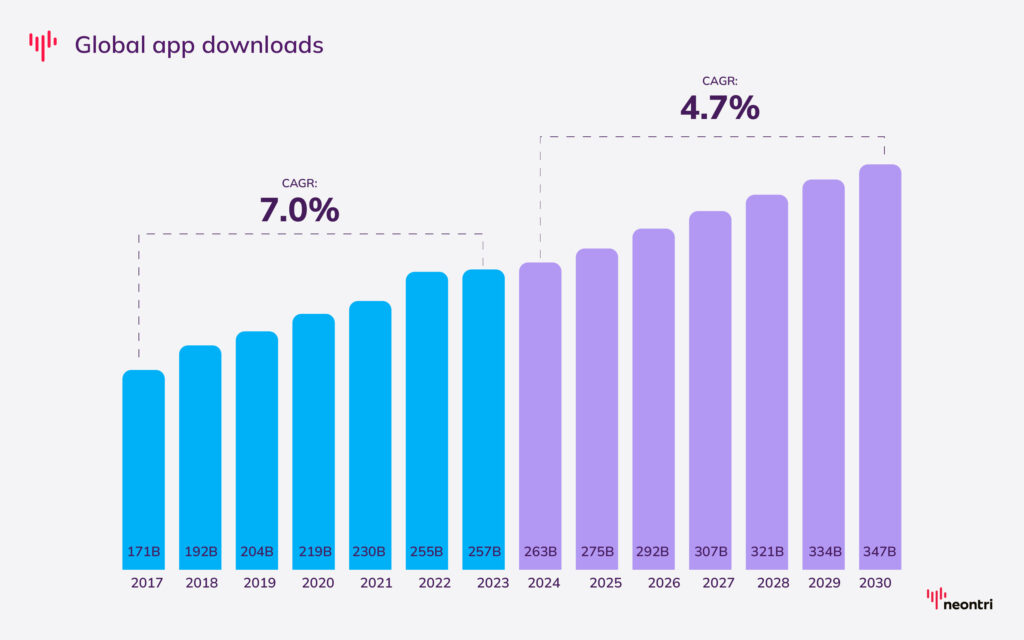
#34: Total app downloads keep climbing, with 347 billion expected by the end of the decade
According to Sensor Tower’s Mobile App Market Forecast 2030, the worldwide app installs are set to rise by 19% between 2026 and 2030, showing that mobile demand remains strong.
After reaching 257 billion in 2023, this figure is forecast to grow to 292 billion in 2026.
Note: These numbers span iOS, Google Play, and third-party Android stores in China, offering a fuller picture of app activity around the world.
#35: Games captured nearly one-third of all app downloads in 2025
Games remained the biggest app category in 2025, with 34.54 billion downloads and a 30.82% share of the global total.
Entertainment came next with 10.04 billion downloads, but the gap between the two was still very large.
Together, Games, Entertainment, Finance, Productivity, and Shopping made up more than half of all app installs worldwide. Lifestyle and Communication also stayed strong, with more than 3 billion downloads each.
| Category | Global downloads (billions) | Download share (%) |
|---|---|---|
| Games | 34.54B | 30.82% |
| Entertainment | 10.04B | 8.96% |
| Finance | 6.84B | 6.10% |
| Productivity | 5.93B | 5.29% |
| Shopping | 5.86B | 5.23% |
| Social | 4.69B | 4.19% |
| Tools | 4.02B | 3.58% |
| Communication | 3.47B | 3.10% |
| Lifestyle | 3.24B | 2.89% |
| Business | 2.57B | 2.36% |
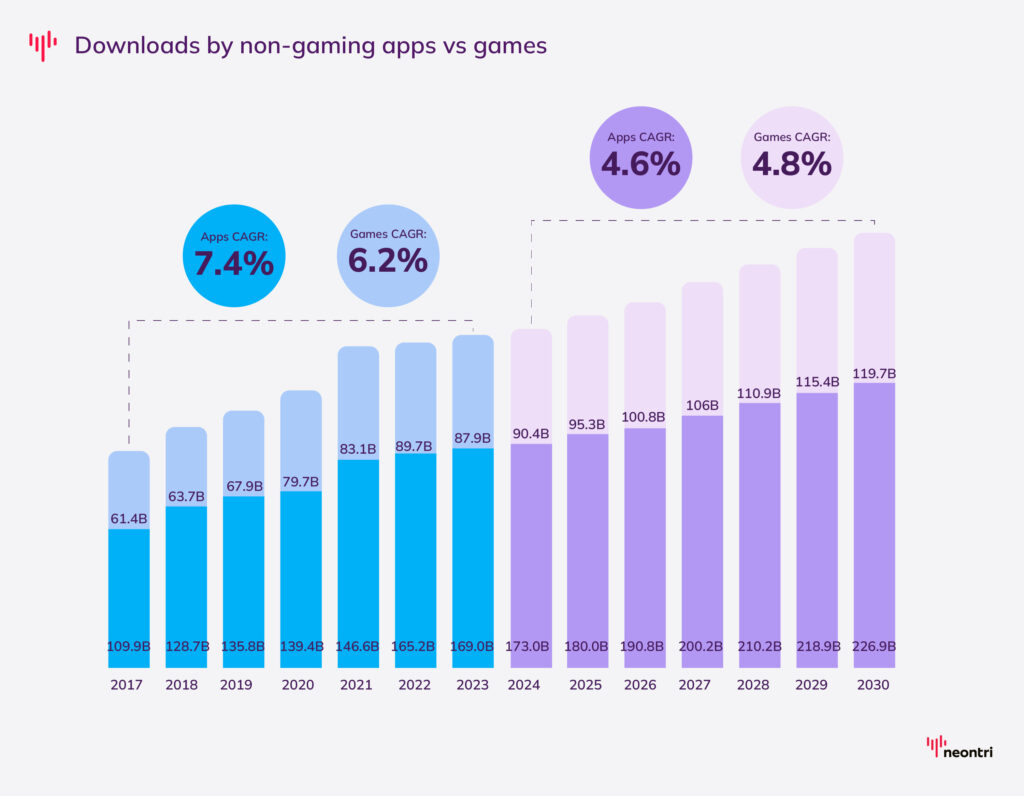
#36: By 2030, non-gaming apps will outnumber game downloads by nearly 2 to 1
The gap between the two categories has been widening for years. In 2023, non-gaming apps recorded 169 billion downloads, compared with 87.9 billion for games.
In 2026, those figures are expected to reach 190.8 billion and 100.8 billion respectively, before climbing to 226.9 billion and 119.7 billion by 2030.
Games are still growing, but non-gaming apps are moving ahead faster.
Note: Apart from iOS and Google Play, this estimate also covers 3rd-party Android stores in China.
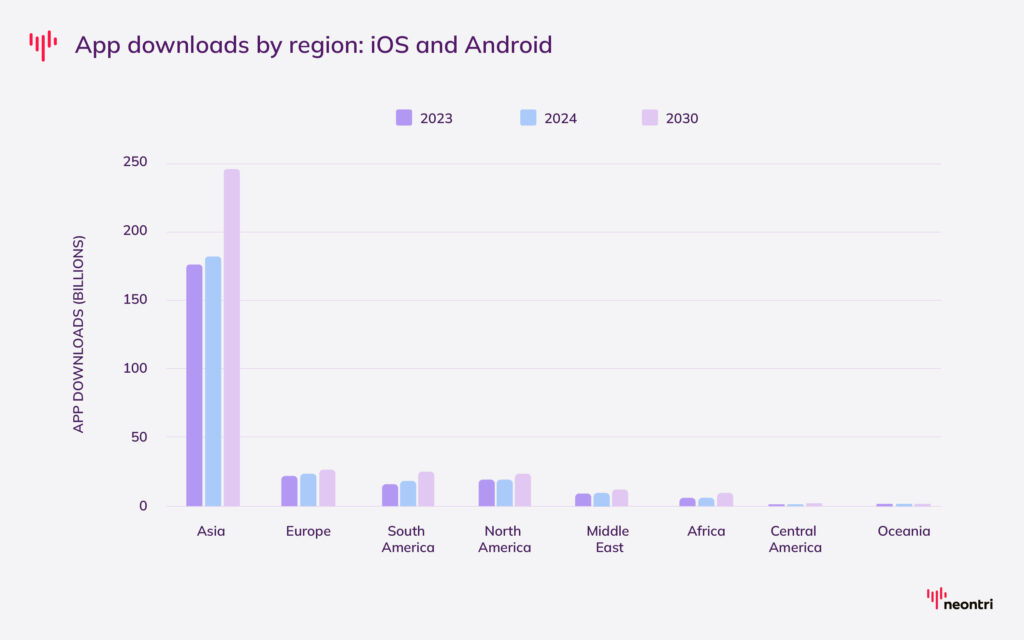
#37: Asia is on track to account for 7 out of every 10 app downloads
App downloads in Asia are forecast to rise from 177 billion in 2023 to 245 billion by the end of the decade, which would leave the region with around 70% of global volume.
The biggest contribution comes from China Mainland, India, and Indonesia, three of the world’s leading mobile markets.
At the same time, South America is expected to overtake North America in downloads, with 37% growth over the forecast period versus 25% in North America.
Note: Beyond iOS and Google Play, this also covers 3rd-party Android stores in China.
#38: App download rankings differed sharply between the App Store and Google Play in 2025
The most-downloaded apps were not the same across platforms. Google Gemini ranked first on the iOS App Store, while ChatGPT led Google Play and the combined global chart.
Social and utility apps such as Instagram, Facebook, WhatsApp, and TikTok Lite also performed more strongly on Google Play, showing clear differences in platform behavior.
Mobile app retention and churn
User retention and churn reveal a lot about how people actually behave once an app is on their phone. Read on to find out what the data says.
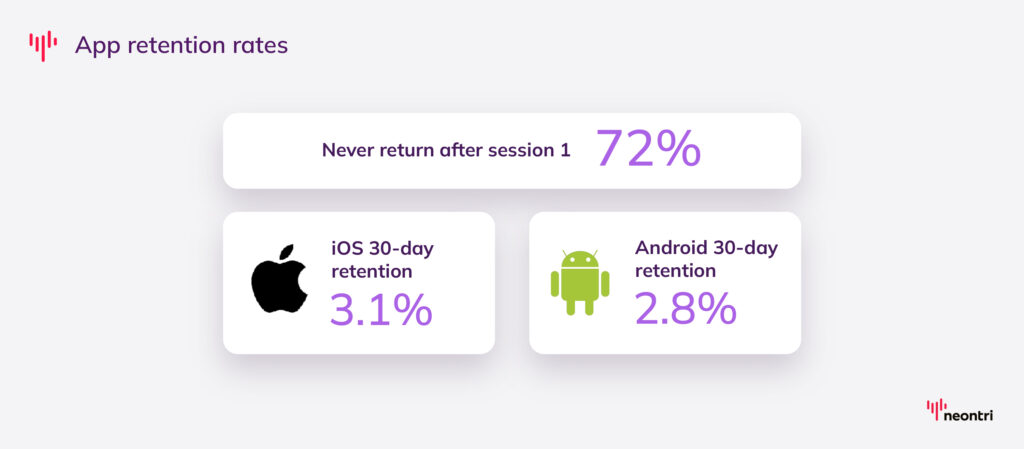
#39: Nearly 72% of users never come back after the first session
For most apps, the first experience decides everything. If users don’t see value right away, almost three quarters leave for good, and the drop-off continues from there.
By day 30, the average app has lost more than 95% of its users, with only 3.1% remaining on iOS and 2.8% on Android.
The first 72 hours are critical.
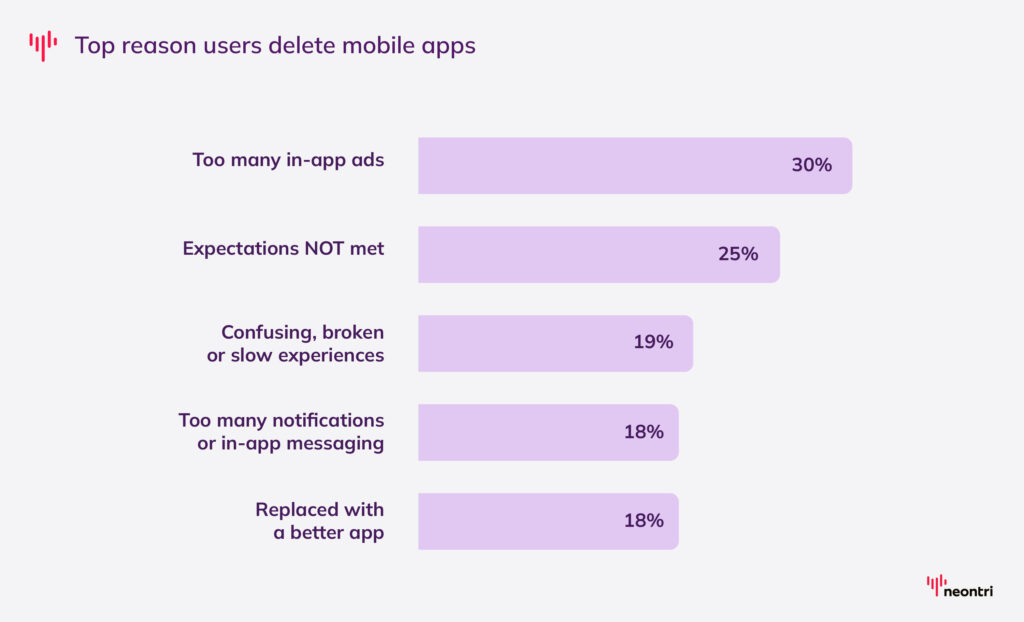
#40: Too many ads are the top reason users delete mobile apps
Among the main reasons for deleting an app, 30% of users point to too many in-app ads.
Other common complaints include:
- Apps that fail to meet expectations (25%)
- Broken or slow experiences (19%)
- Too many notifications or in-app messages (18%)
- Switching to another app (18%)
Note: Respondents could select more than one reason.
AI and emerging mobile app trends
The mobile market is entering a new phase shaped by AI and other fast-moving developments. See what is starting to change.
#41: AI Assistant downloads jumped 148% in 2025
AI Assistant apps were one of the fastest-growing subgenres on mobile in 2025, with installs nearly 2.5x higher than the year before. No other major app category came close to that pace of growth.
#42: Time spent in AI apps surged 426% in a single year
AI apps are becoming part of everyday mobile use. In 2025, users spent more than 5 times as long inside AI apps as they did a year earlier, pushing the category into the global top 10 by time spent.
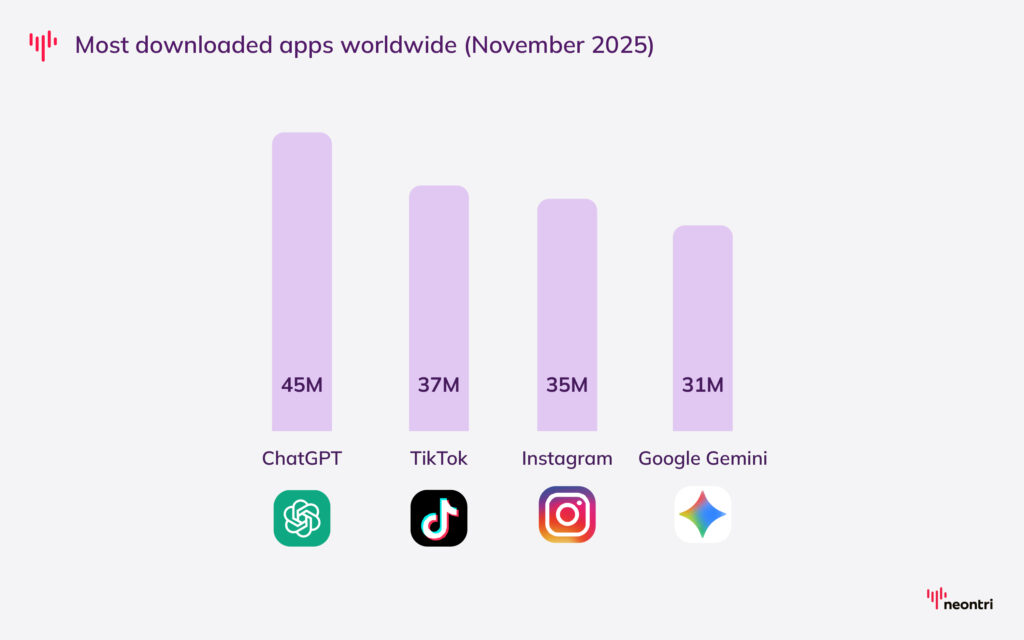
#43: ChatGPT became the world’s most-downloaded app in November 2025
ChatGPT led global app downloads in November 2025 with 45 million installs across the App Store and Google Play, followed by TikTok (37 million) and Instagram (35 million).
Google Gemini ranked fourth with 31 million downloads, meaning two generative AI apps now sit among the four most downloaded apps in the world, competing directly with the biggest social platforms.
#44: Asia, not the US, is now the center of AI adoption
The US once accounted for 20% of global AI app downloads. That share has dropped to just 11%. Asian markets (especially India and China) are now driving the fastest growth, making AI a genuinely global phenomenon.
Why it matters for businesses
Mobile is where customers now spend 3.6 hours a day and where $167 billion was spent in 2025 alone. For businesses that plan to stay ahead of the competition, allocating budget wisely, and focusing on the platforms, categories, and regions that drive the most value is no longer something to plan for later. It’s the priority now.
Subscriptions now drive 96% of app revenue, which makes retention and recurring value critical, not optional. If an app fails to prove its worth in the first session, nearly three quarters of users will not return.
Sources
https://www.precedenceresearch.com/mobile-application-market
https://sensortower.com/report/forecast-report/download
https://sensortower.com/report/state-of-mobile-2026
https://sensortower.com/blog/state-of-ai-apps-market-overview-2025
https://yougov.com/en-us/articles/52810-reality-checks-talkshow-paid-app-subscriptions-jon-yantz
https://www.statista.com/statistics/1489711/total-global-app-spending/
https://techcrunch.com/2026/01/14/app-downloads-declined-again-in-2025-but-consumer-spending-soared-to-nearly-156b/
https://www.apptweak.com/en/reports/most-downloaded-apps-globally-android-ios
https://passport-photo.online/blog/mobile-app-usage-statistics/
https://www.ericsson.com/en/reports-and-papers/mobility-report/key-figures
https://www.ericsson.com/en/reports-and-papers/mobility-report/dataforecasts/mobile-traffic-forecast
https://jobs.apple.com/en-sa/details/200635361-3350/analytics-data-engineer-app-store
https://42matters.com/google-play-statistics-and-trends
https://42matters.com/ios-apple-app-store-statistics-and-trends
https://www.statista.com/statistics/266210/number-of-available-applications-in-the-google-play-store/
https://techchannel.news/people-spend-15-6b-hours-on-genai-apps-in-first-half-of-2025/
https://explodingtopics.com/blog/smartphone-stats
https://www.businessresearchinsights.com/market-reports/mobile-app-market-119293
https://www.fortunebusinessinsights.com/mobile-application-market-114651
https://www.grandviewresearch.com/horizon/outlook/mobile-application-market/asia-pacific
https://www.statista.com/statistics/256347/
https://www.emarketer.com/content/entertainment-outlasts-other-mobile-categories
https://www.airship.com/resources/mobile-lifecycle-benchmarks-engagement/
https://www.tekrevol.com/blogs/mobile-app-download-statistics/
https://www.apptweak.com/en/reports/app-downloads-by-category
https://www.statista.com/statistics/1020996/distribution-of-free-and-paid-ios-apps/
https://www.revenuecat.com/state-of-subscription-apps-2025/