

Shopping has never stayed still. It moved from markets to high streets, from high streets to shopping centres, from shopping centres to desktop browsers, and now, unmistakably, to the smartphone. Mobile commerce crossed the majority threshold of all global online sales and has not looked back.
Key statistics at a glance
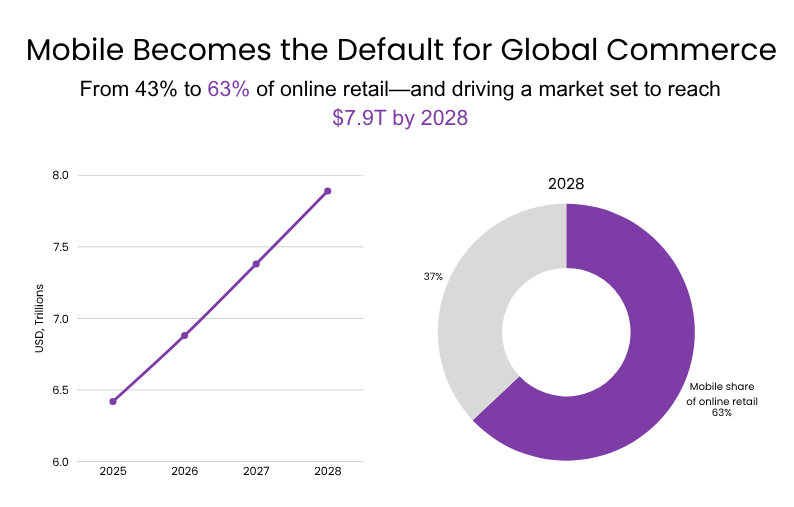
- Mobile e-commerce generated around $1.7 trillion in 2023, more than half of all online retail sales globally. The mobile share has been climbing steadily, rising from 43% in 2018 and expected to reach 63% by 2028
- Worldwide e-commerce is projected to expand from $6.42 trillion in 2025 to $7.89 trillion by 2028
- As of the third quarter of 2025, smartphones constituted around 78% of retail site traffic globally, responsible for generating 70% of online shopping orders
- Mobile wallets handled around 53% of all global e-commerce payments in 2024, more than any other method, and are growing at 18.1% annually through 2030. Credit cards came second at 20% but are expected to fall to 13% by 2030
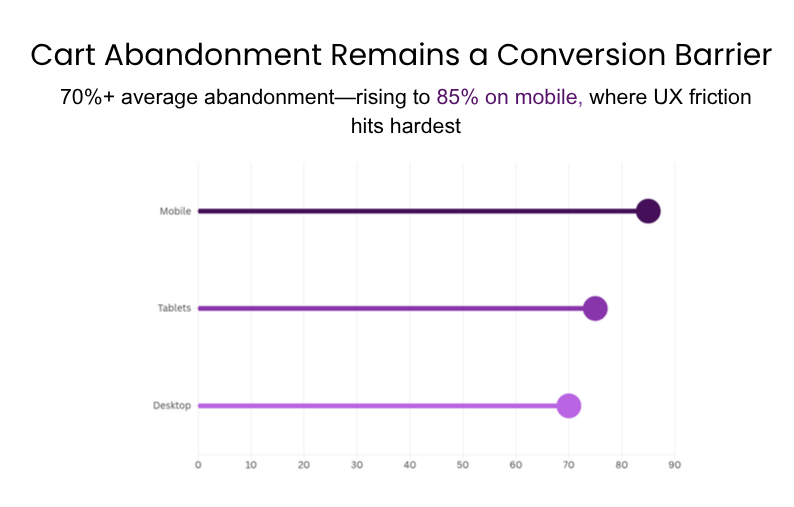
- In the first quarter of 2025, around four in five of US shopping carts were abandoned before checkout and the problem was worse on mobile, where the abandonment rate hit 85%
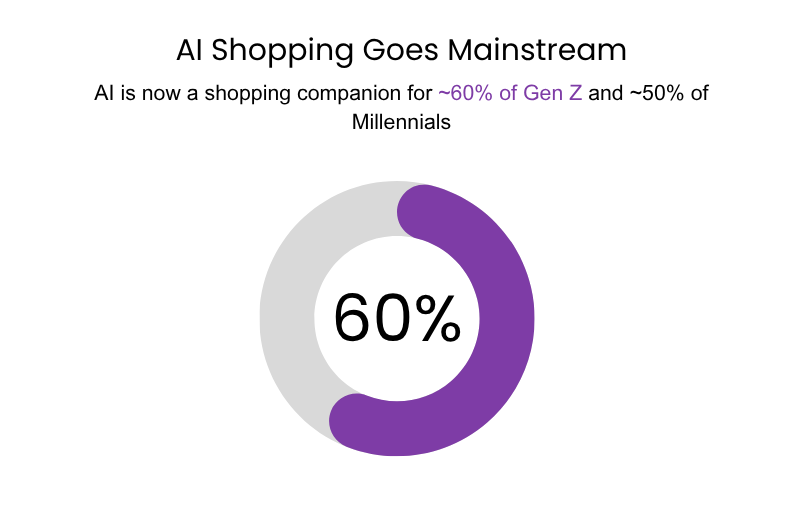
- Nearly 60% of Gen Z shoppers used an AI assistant or ChatGPT to help with online purchases, and close to half of Millennials did the same
- 92% of Chinese consumers had shopped on their smartphone in the previous year, underscoring China’s dominance in mobile commerce
- The proportion of consumers who start their product search on TikTok grew 36% year-on-year, while Amazon’s share of initial searches fell over the same period
#1: Mobile commerce: 63% of global online sales by 2028
Mobile is no longer a growing channel or a secondary screen. It is the primary way the world shops. The mobile share of online retail has climbed steadily from 43% in 2018 and is forecast to reach 63% by 2028.
To put the trajectory in concrete terms: global e-commerce is forecast to reach $6.42 trillion in 2025, before rebounding to $6.88 trillion in 2026, $7.38 trillion in 2027, and $7.89 trillion in 2028.
#2: Online retail hits 1 in 5 purchases—mobile leads growth worldwide
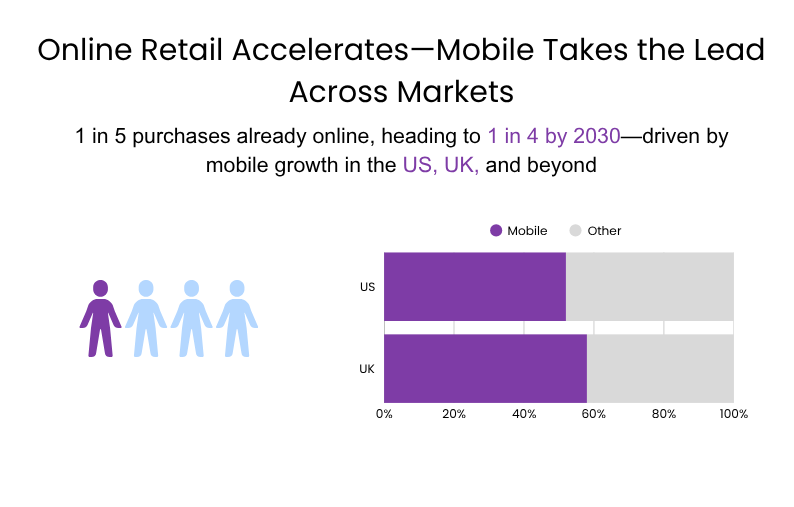
More than one in five retail purchases worldwide now happen online, a share set to rise to one in four by 2030.
The US tells a similar story: mobile devices drove more than 46% of US online retail sales in 2025, a share forecast to cross 52% by 2029, making mobile the clear majority channel. US mobile retail sales surpassed $577 billion in 2025 and are projected to nearly double to around $840 billion by 2029.
The pattern holds across every major market. Canada’s online retail market is forecast to be worth nearly $68 billion in 2025, growing to over $86 billion by 2030. UK mobile commerce reached close to £92 billion in 2023 and is expected to exceed £109 billion by 2027, with just over half of all UK e-commerce sales already made on mobile, a share forecast to reach 57.6% by 2027.
#3: Smartphones: 78% of retail site traffic globally, 70% of online shopping orders
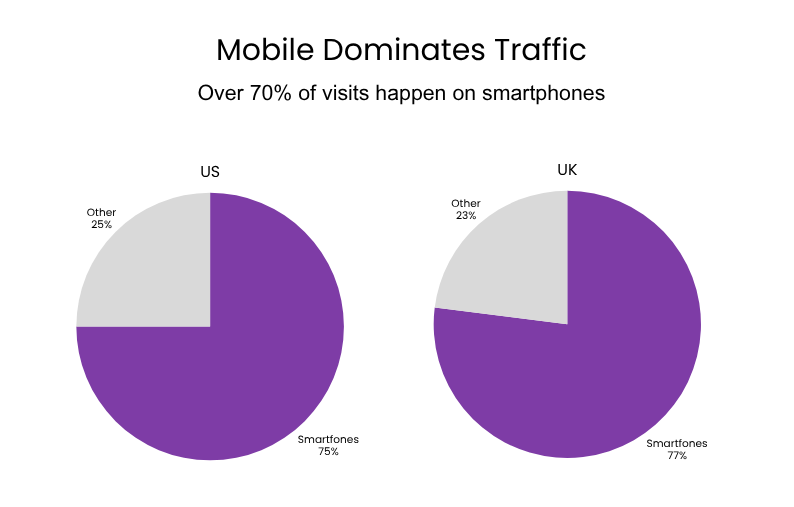
Shoppers have moved to mobile for browsing but have not fully followed through at checkout. In the US, smartphones drove around 75% of retail site visits in the third quarter of 2025, but only two-thirds of purchases. Desktops, despite making up just 22% of traffic, accounted for 31% of completed orders.
The UK tells a similar but tighter story: smartphones were used for 77% of retail site visits and 75% of orders in the second quarter of 2025, with desktops contributing 21% of traffic and 23% of purchases.
#4: Big screens win for considered purchases but tablets lead conversion at 2.9%
For larger, more considered purchases, shoppers still gravitate toward the bigger screen. Yet tablets complicate the picture: they led all devices with a 2.9% e-commerce conversion rate, ahead of desktops, against an industry average of 2.4%.
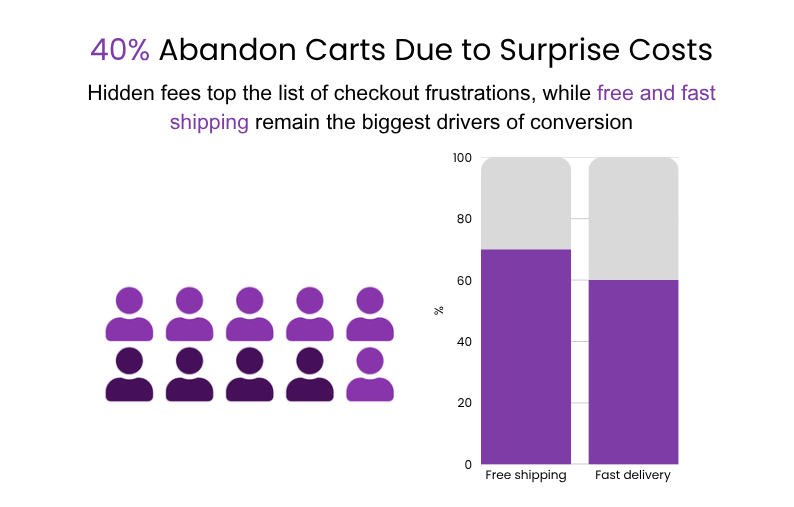
#5: Close to 40% of US shoppers walked away from a purchase because of unexpected extra costs at checkout
Surprise fees are the single biggest reason people leave without buying, though unexpected account creation requirements and slow delivery times are also significant drivers of abandonment. Free shipping is the top delivery priority for around 70% of US online shoppers, with fast delivery a close second at 60%.
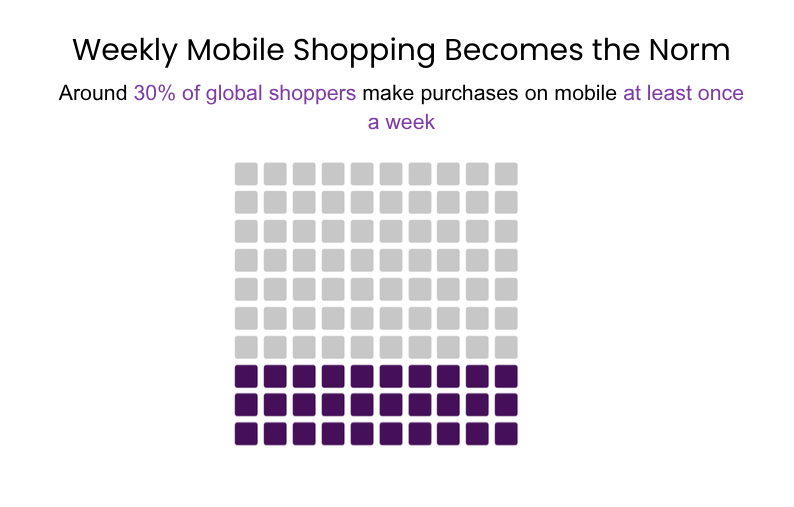
#6: Around 30% of online shoppers worldwide made a mobile purchase at least once a week
Mobile was responsible for nearly 80% of retail site visits and 66% of orders globally. Fashion is among the strongest-performing categories overall, including in Canada.
China continues to operate in a different league entirely. More than a quarter of all consumer goods sold there in 2024 were purchased online, far above the global norm.
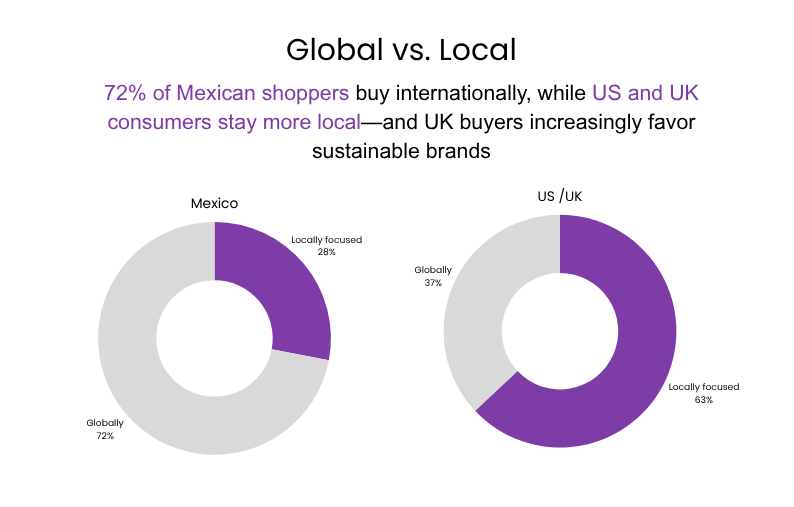
#7: Over half of global online shoppers bought from both local and international retailers
Mexico leading at 72%, while US and UK shoppers remained more locally focused at 63%.
Meanwhile, UK shoppers are placing growing importance on sustainability and ethics, driving increased demand for eco-friendly products and brands with clear social responsibility credentials.
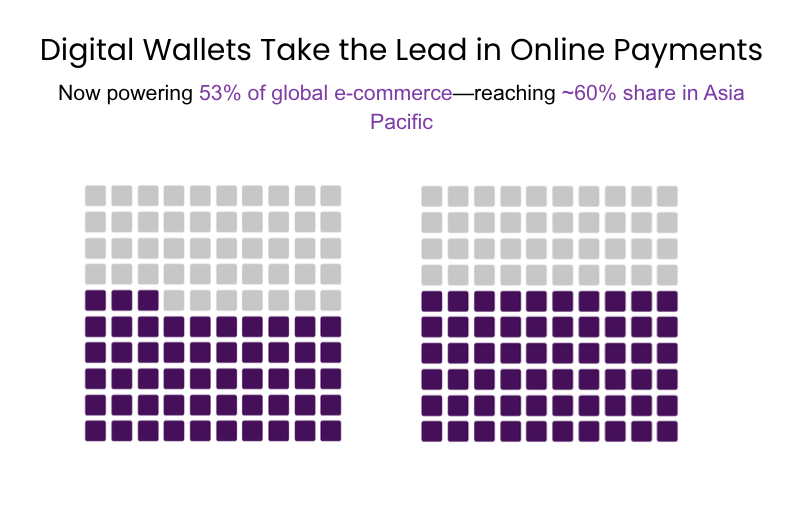
#8: Mobile wallets handled around 53% of all global e-commerce payments
Credit cards came second at 20% but are expected to fall to 13% by 2030.
The shift is most advanced in Asia Pacific, where digital wallets already dominated e-commerce payments with a roughly 60% share back in 2020, compared to just around 20% in Latin America at the same time.
In the UK, four in ten online shoppers used a digital wallet to pay in 2024, though credit and debit cards remained widely used alongside them.
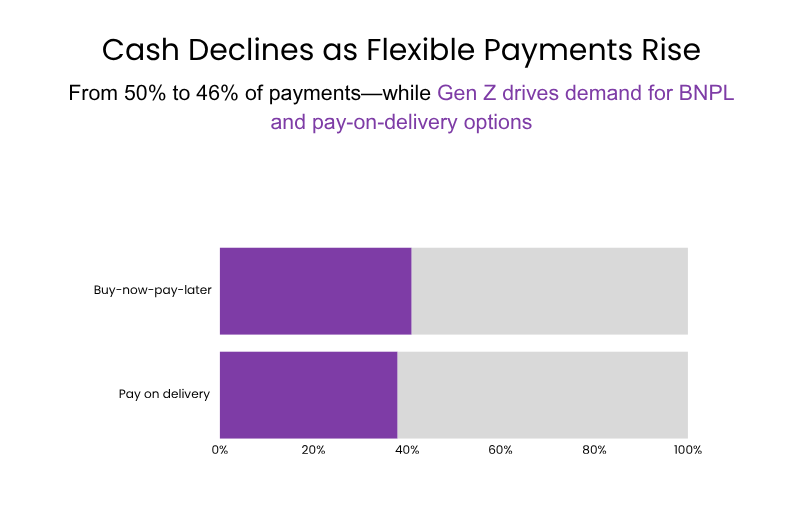
#9: Cash declines: 50% to 46% of payments
The generational dimension of this shift is equally significant. Having grown up with smartphones, Gen Z shoppers have been key drivers of digital wallet adoption, drawn to the speed, simplicity, and security they offer both online and in physical stores.
French Gen Z shoppers illustrate the broader expectation for flexibility: 41% wanted buy-now-pay-later installment options, and 38% expected to be able to pay on delivery.
#10: Shopping apps have become essential for retailers
Temu topped US download charts in 2023, just a year after launch. Shein ranked second, leading the fashion and beauty app category, while Amazon and Walmart came in third and fourth.
Amazon and Walmart are responding: both have integrated augmented reality into their apps, letting shoppers virtually place furniture and home décor items in their own space before buying. The competitive landscape for shopping apps is shifting faster than at any point in the past decade, and neither the apps people use to shop nor their loyalty to them should be considered permanent.


Is Your Mobile App Costing You Conversions?
Audit your e-commerce experience to reduce friction, boost checkout, and capture more mobile revenue
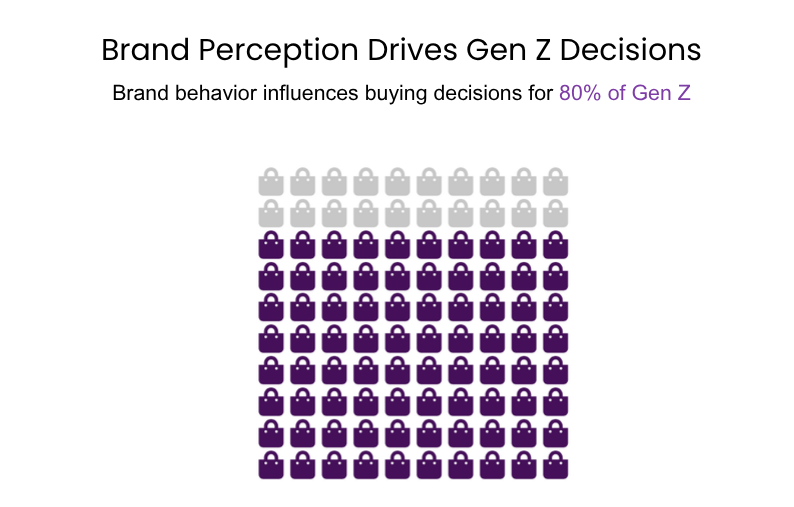
#11: Gen Z leads behavior shift: ~33% shop daily, 80% influenced by brand values
The generational contrasts elsewhere in the data are equally striking. Nearly a third of Gen Z shops online every single day, compared to just 7% of Baby Boomers. Eight in ten Gen Z consumers have altered a buying decision because of how a brand behaves or is perceived.
#12: AI in commerce: 1 in 10 start with AI, 1 in 5 ready to let it buy
Advances in AI and data analytics are driving a shift toward more personalized shopping, with tailored product recommendations becoming a standard part of the online shopping experience. AI-enhanced extended reality has reached the point where online retailers can offer product experiences that rival, and in some cases surpass, what customers get in a physical store.
AI shopping is going mainstream, with around 60% of Gen Z and nearly half of Millennials using it to support their purchase decisions.
#13: Search shifts: TikTok up 36%, Amazon declines
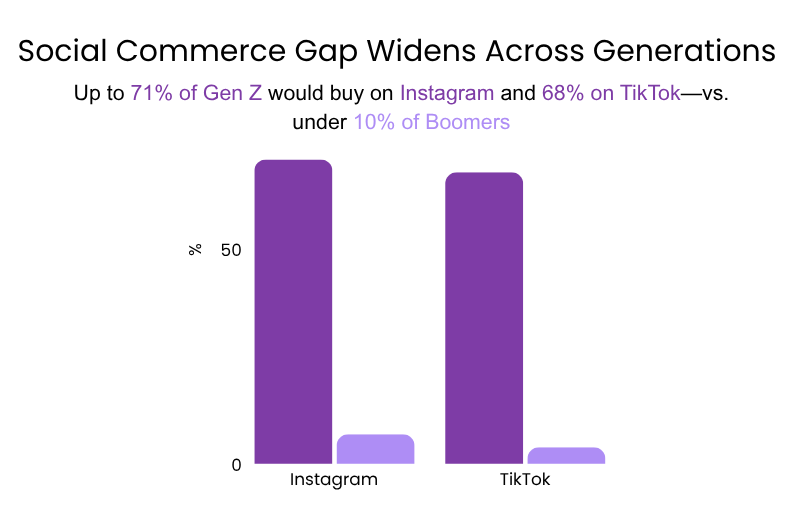
The platform where shopping journeys begin has shifted for an entire generation. For Gen Z, TikTok is now the most popular starting point for product searches. 43% open it first, surpassing Google. Younger generations are significantly more open to buying directly through social media platforms, with Gen Z and Millennials leading the way and Baby Boomers the least likely to do so.
On Instagram, 71% of Gen Z say they would purchase directly on the platform compared to just 7% of Boomers. On TikTok, 68% of Gen Z would buy directly versus only 4% of Boomers. Facebook, despite its older reputation, has the broadest purchase intent across all generations at 49%, making it the one platform where every demographic is still showing up to shop.
#14: Cart abandonment: Mobile still leads in friction
Cart abandonment remains a defining challenge in digital commerce, with an average global rate of 70.22% based on aggregated industry studies. The gap between devices is significant. Desktop abandonment typically ranges between 65–70%, driven largely by shipping costs, price comparison, and browsing distractions.
On mobile, rates climb to 78–85%, where smaller screens amplify friction—especially during form filling, payment input, and navigation. Tablets sit in the middle at 70–75%, offering a smoother experience than smartphones but still falling short of desktop efficiency. Together, these benchmarks highlight how device-specific UX barriers continue to directly impact conversion.
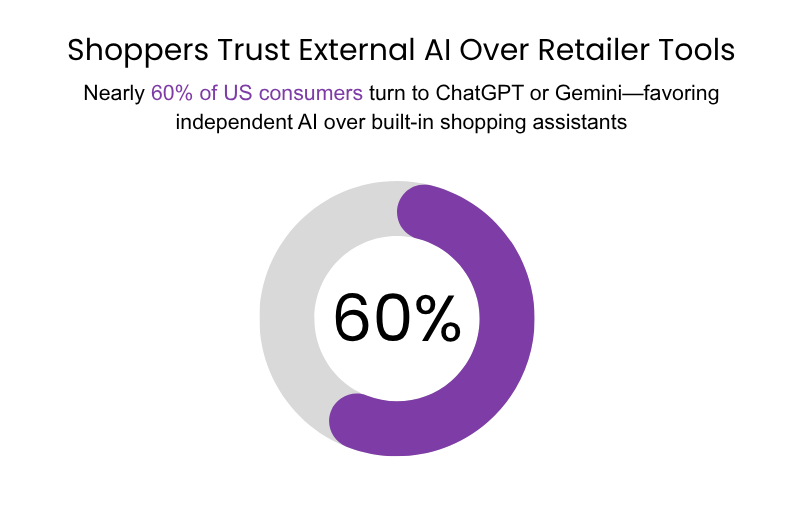
#15: Nearly 60% of US shoppers still prefer to turn to external tools like ChatGPT or Gemini for shopping assistance
Despite heavy investment in on-site AI, retailers have not yet won the trust battle. Shoppers are choosing the tools they found themselves over the ones built into the checkout flow.
The strategic takeaway
What began as a gradual shift away from desktop has become the dominant commercial reality of modern retail, and the pace of change shows no sign of slowing.
Mobile itself continues to evolve. The device that displaced the desktop is now the primary platform through which consumers discover products, complete transactions, and increasingly seek purchasing guidance from AI. The smartphone has not simply changed where people shop, it has changed how they search, how they pay, and the level of experience they require before committing to a purchase.
For retailers, the strategic implication is clear. Consumer attention, intent, and spending power are concentrated on mobile. The businesses best positioned for the next phase of growth will be those that understand this not as a channel consideration, but as the foundation of their entire commercial strategy.
Sources
https://www.statista.com/statistics/1449284/retail-mobile-commerce-revenue-worldwide/
https://www.emarketer.com/learningcenter/guides/mobile-commerce-shopping-trends-stats/
https://ecommerce-europe.eu/wp-content/uploads/2024/10/CMI2024_Complete_light_v1.pdf
https://www.jpmorgan.com/content/dam/jpm/treasury-services/documents/global-e-commerce-trends-report.pdf
https://www.statista.com/statistics/249855/mobile-retail-commerce-revenue-in-the-united-states/
https://www.shopify.com/blog/global-ecommerce-sales
https://www.statista.com/statistics/289741/canada-retail-e-commerce-sales/
https://ec.europa.eu/eurostat/statistics-explained/index.php?title=E-commerce_statistics
https://www.statista.com/topics/11883/mobile-commerce-worldwide/
https://elementor.com/blog/ecommerce-statistics/
https://www.statista.com/statistics/1228452/reasons-for-abandonments-during-checkout-united-states/
https://www.sellerscommerce.com/blog/mobile-commerce-statistics/
https://customcy.com/blog/mobile-commerce-statistics/
https://www.statista.com/topics/871/online-shopping/
https://www.mobiloud.com/blog/mobile-commerce-statistics
https://www.statista.com/statistics/1111233/payment-method-usage-transaction-volume-share-worldwide/
https://www.outerboxdesign.com/articles/digital-marketing/mobile-ecommerce-statistics/
https://tech.co/website-builders/mobile-commerce-statistics
https://www.statista.com/statistics/1271701/share-of-digital-wallets-payments-in-e-commerce-by-region/
https://www.invespcro.com/blog/us-mobile-commerce/
https://www.oberlo.com/statistics/mobile-commerce-sales
https://redstagfulfillment.com/what-percentage-of-ecommerce-sales-on-mobile-devices/
https://www.statista.com/topics/4872/mobile-payments-worldwide/
https://www.vennapps.com/blog/35-essential-stats-on-mobile-commerce-in-2025
https://www.mckinsey.com/industries/financial-services/our-insights/global-payments-report#/
https://www.statista.com/topics/11087/gen-z-online-shopping-behavior/
https://www.thomsonreuters.com/en-us/posts/human-rights-crimes/gen-z-purchasing-power/
https://www.junglescout.com/wp-content/uploads/2023/03/Jungle-Scout-Consumer-Trends-Report-Q1-2023.pdf
https://www.statista.com/statistics/1243875/cart-abandonment-rate-in-the-us/
https://blendcommerce.com/blogs/shopify/ecommerce-conversion-rate-benchmarks-2026
https://www.statista.com/statistics/270073/online-shopping-cart-abandonment-rate-in-the-united-states/
https://www.statista.com/statistics/1334030/cart-abandonment-rate-by-category-and-device/
https://blendcommerce.com/blogs/shopify/ecommerce-conversion-rate-benchmarks-2026
https://www.grandviewresearch.com/industry-analysis/social-commerce-market
https://www.oberlo.com/statistics/mobile-commerce-sales
https://soax.com/research/mobile-ecommerce-stats
https://www.flowlu.com/blog/productivity/ecommerce-statistics/
https://www.mobiloud.com/blog/mobile-apps-vs-mobile-websites
https://sensortower.com/blog/state-of-mobile-retail
https://www.sellerscommerce.com/blog/ecommerce-statistics/
https://www.aciworldwide.com/wp-content/uploads/2025/01/2025-Mobile-Wallet-Trend-Report.pdf
https://goatagency.com/blog/gen-z-social-commerce/
https://marketingltb.com/blog/statistics/mobile-ecommerce-statistics/
https://baymard.com/lists/cart-abandonment-rate